ICICI Bank 2015 Annual Report Download - page 102
Download and view the complete annual report
Please find page 102 of the 2015 ICICI Bank annual report below. You can navigate through the pages in the report by either clicking on the pages listed below, or by using the keyword search tool below to find specific information within the annual report.-
 1
1 -
2
-
3
-
4
-
5
-
6
-
7
-
8
-
9
-
10
-
11
-
12
-
13
-
14
-
15
-
16
-
17
-
18
-
19
-
20
-
21
-
22
-
23
-
24
-
25
-
26
-
27
-
28
-
29
-
30
-
31
-
32
-
33
-
34
-
35
-
36
-
37
-
38
-
39
-
40
-
41
-
42
-
43
-
44
-
45
-
46
-
47
-
48
-
49
-
50
-
51
-
52
-
53
-
54
-
55
-
56
-
57
-
58
-
59
-
60
-
61
-
62
-
63
-
64
-
65
-
66
-
67
-
68
-
69
-
70
-
71
-
72
-
73
-
74
-
75
-
76
-
77
-
78
-
79
-
80
-
81
-
82
-
83
-
84
-
85
-
86
-
87
-
88
-
89
-
90
-
91
-
 92
92 -
 93
93 -
 94
94 -
 95
95 -
 96
96 -
 97
97 -
 98
98 -
 99
99 -
 100
100 -
 101
101 -
 102
102 -
 103
103 -
 104
104 -
 105
105 -
 106
106 -
 107
107 -
 108
108 -
 109
109 -
 110
110 -
 111
111 -
 112
112 -
113
-
114
-
115
-
116
-
117
-
118
-
119
-
120
-
121
-
122
-
123
-
124
-
125
-
126
-
127
-
128
-
129
-
130
-
131
-
132
-
133
-
134
-
135
-
136
-
137
-
138
-
139
-
140
-
141
-
142
-
143
-
144
-
145
-
146
-
147
-
148
-
149
-
150
-
151
-
152
-
153
-
154
-
155
-
156
-
157
-
158
-
159
-
160
-
161
-
162
-
163
-
164
-
165
-
166
-
167
-
168
-
169
-
170
-
171
-
172
-
173
-
174
-
175
-
176
-
177
-
178
-
179
-
180
-
181
-
182
-
183
-
184
-
185
-
186
-
187
-
188
-
189
-
190
-
191
-
192
-
193
-
194
-
195
-
196
-
197
-
198
-
199
-
200
-
201
-
202
-
203
-
204
-
205
-
206
-
207
-
208
-
209
-
210
-
211
-
212
-
213
-
214
-
215
-
216
-
217
-
218
-
219
-
220
-
221
-
222
-
223
-
224
-
225
-
226
-
227
-
228
-
229
-
230
-
231
-
232
-
233
-
234
-
235
-
236
 |
 |
Management’s Discussion & Analysis
100 Annual Report 2014-2015
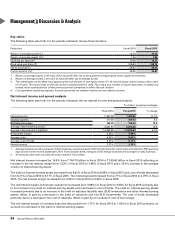
Fixed and other assets
Fixed assets (net block) increased marginally from ` 46.78 billion at March 31, 2014 to ` 47.26 billion at March 31, 2015. Other
assets decreased from ` 327.09 billion at March 31, 2014 to ` 249.97 billion at March 31, 2015 primarily due to decrease in
MTM amount and receivables on foreign exchange and derivative transactions and trade receivables pending settlement.
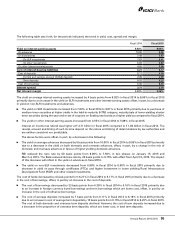
Liabilities
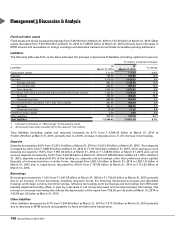
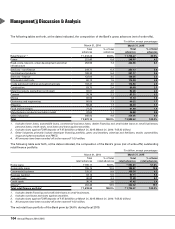
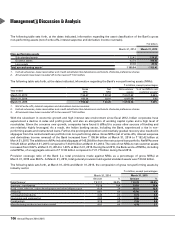
The following table sets forth, at the dates indicated, the principal components of liabilities (including capital and reserves).
` in billion, except percentages
Liabilities At
March 31, 2014
At
March 31, 2015 % change
Equity share capital ` 11.55 ` 11.60 0.4%
Reserves 720.58 792.69 10.0
Deposits 3,319.14 3,615.63 8.9
- Savings deposits 991.33 1,148.60 15.9
- Current deposits 432.45 495.20 14.5
- Term deposits 1,895.35 1,971.83 4.0
Borrowings (excluding subordinated debt and preference share capital) 1,142.24 1,315.29 11.4
- Domestic 333.38 456.29 36.9
- Overseas branches 808.86 859.00 6.2
Subordinated debt (included in Tier-1 and Tier-2 capital) 401.85 405.39 0.9
- Domestic 381.51 384.16 0.7
- Overseas branches 20.34 21.23 4.4
Preference share capital13.50 3.50 0.0
Other liabilities 347.56 317.19 (8.7)
Total liabilities ` 5,946.42 ` 6,461.29 8.7%
1. Included in Schedule 4 - “Borrowings” of the balance sheet.
2. All amounts have been rounded off to the nearest ` 10.0 million.
Total liabilities (including capital and reserves) increased by 8.7% from ` 5,946.42 billion at March 31, 2014 to
` 6,461.29 billion at March 31, 2015, primarily due to a 8.9% increase in deposits and a 11.4% increase in borrowings.
Deposits
Deposits increased by 8.9% from ` 3,319.14 billion at March 31, 2014 to ` 3,615.63 billion at March 31, 2015. Term deposits
increased by 4.0% from ` 1,895.35 billion at March 31, 2014 to ` 1,971.83 billion at March 31, 2015, while savings account
deposits increased by 15.9% from ` 991.33 billion at March 31, 2014 to ` 1,148.60 billion at March 31, 2015 and current
account deposits increased by 14.5% from ` 432.45 billion at March 31, 2014 to ` 495.20 billion at March 31, 2015. At March
31, 2015, deposits constituted 67.8% of the funding (i.e., deposits and borrowings, other than preference share capital).
Deposits of overseas branches, in dollar terms, decreased from USD 2.6 billion at March 31, 2014 to USD 1.8 billion at
March 31, 2015 and, in rupee terms, decreased by 28.6% from ` 157.59 billion at March 31, 2014 to ` 112.53 billion at
March 31, 2015.
Borrowings
Borrowings increased by 11.4% from ` 1,547.59 billion at March 31, 2014 to ` 1,724.18 billion at March 31, 2015 primarily
due to an increase in bond borrowings including long-term bonds (for financing infrastructure projects and affordable
housing) and foreign currency bond borrowings, refinance borrowings, term borrowings and borrowings from RBI under
liquidity adjustment facility, offset, in part, by a decrease in call money borrowed and commercial paper borrowings. The
increase in overseas borrowing also reflects the depreciation of the rupee from ` 59.92 per US dollar at March 31, 2014 to
` 62.50 per US dollar at March 31, 2015.
Other liabilities
Other liabilities decreased by 8.7% from ` 347.56 billion at March 31, 2014 to ` 317.19 billion at March 31, 2015 primarily
due to decrease in MTM amount and payables on forex and derivative transactions.