ICICI Bank 2015 Annual Report Download - page 163
Download and view the complete annual report
Please find page 163 of the 2015 ICICI Bank annual report below. You can navigate through the pages in the report by either clicking on the pages listed below, or by using the keyword search tool below to find specific information within the annual report.-
 1
1 -
2
-
3
-
4
-
5
-
6
-
7
-
8
-
9
-
10
-
11
-
12
-
13
-
14
-
15
-
16
-
17
-
18
-
19
-
20
-
21
-
22
-
23
-
24
-
25
-
26
-
27
-
28
-
29
-
30
-
31
-
32
-
33
-
34
-
35
-
36
-
37
-
38
-
39
-
40
-
41
-
42
-
43
-
44
-
45
-
46
-
47
-
48
-
49
-
50
-
51
-
52
-
53
-
54
-
55
-
56
-
57
-
58
-
59
-
60
-
61
-
62
-
63
-
64
-
65
-
66
-
67
-
68
-
69
-
70
-
71
-
72
-
73
-
74
-
75
-
76
-
77
-
78
-
79
-
80
-
81
-
82
-
83
-
84
-
85
-
86
-
87
-
88
-
89
-
90
-
91
-
92
-
93
-
94
-
95
-
96
-
97
-
98
-
99
-
100
-
101
-
102
-
103
-
104
-
105
-
106
-
107
-
108
-
109
-
110
-
111
-
112
-
113
-
114
-
115
-
116
-
117
-
118
-
119
-
120
-
121
-
122
-
123
-
124
-
125
-
126
-
127
-
128
-
129
-
130
-
131
-
132
-
133
-
134
-
135
-
136
-
137
-
138
-
139
-
140
-
141
-
142
-
143
-
144
-
145
-
146
-
147
-
148
-
149
-
150
-
151
-
152
-
 153
153 -
 154
154 -
 155
155 -
 156
156 -
 157
157 -
 158
158 -
 159
159 -
 160
160 -
 161
161 -
 162
162 -
 163
163 -
 164
164 -
 165
165 -
 166
166 -
 167
167 -
 168
168 -
 169
169 -
 170
170 -
 171
171 -
 172
172 -
 173
173 -
174
-
175
-
176
-
177
-
178
-
179
-
180
-
181
-
182
-
183
-
184
-
185
-
186
-
187
-
188
-
189
-
190
-
191
-
192
-
193
-
194
-
195
-
196
-
197
-
198
-
199
-
200
-
201
-
202
-
203
-
204
-
205
-
206
-
207
-
208
-
209
-
210
-
211
-
212
-
213
-
214
-
215
-
216
-
217
-
218
-
219
-
220
-
221
-
222
-
223
-
224
-
225
-
226
-
227
-
228
-
229
-
230
-
231
-
232
-
233
-
234
-
235
-
236
 |
 |
161Annual Report 2014-2015
forming part of the Accounts (Contd.)
Schedules
Financial Statements of ICICI Bank Limited
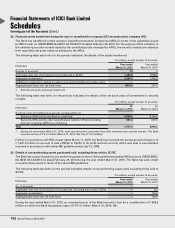
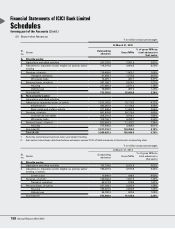
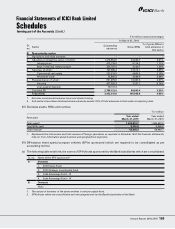
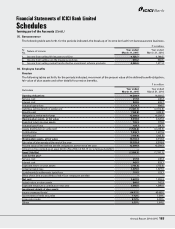
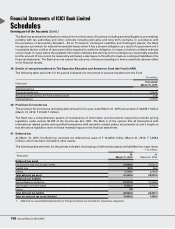
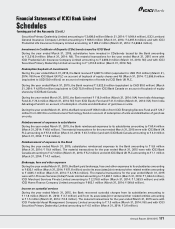
The following table sets forth, for the periods indicated, the summary of exposure to real estate sector.
` in million
Real estate sector At
March 31, 2015
At
March 31, 2014
I. Direct exposure 1,340,716.4 1,092,006.3
i) Residential mortgages
of which: individual housing loans eligible for priority sector advances
945,862.1 752,096.2
172,465.4 162,487.3
ii) Commercial real estate1356,451.4 300,215.1
iii) Investments in mortgage backed securities (MBS) and other securitised
exposure
38,402.9 39,695.0
a. Residential 36,624.4 37,205.1
b. Commercial real estate 1,778.5 2,489.9
II. Indirect exposure 85,681.9 71,901.4
i) Fund based and non-fund based exposures on National Housing Bank (NHB)
and Housing Finance Companies (HFCs)
85,681.9 71,901.4
ii) Others ––
Total exposure to real estate sector21,426,398.3 1,163,907.7
1. Commercial real estate exposure include loans to individuals against non-residential premises, loans given to land and building
developers for construction, corporate loans for development of special economic zone, loans to borrowers where servicing of
loans is from a real estate activity and exposures to mutual funds/venture capital funds/private equity funds investing primarily
in the real estate companies.
2. Excludes non-banking assets acquired in satisfaction of claims.
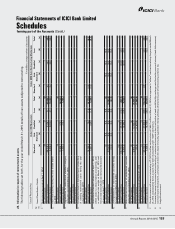
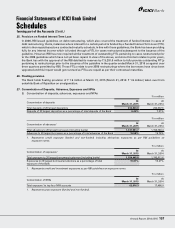
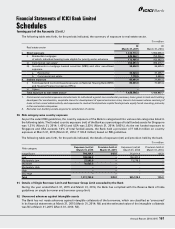
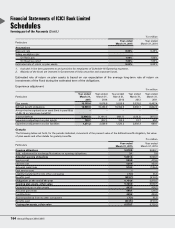
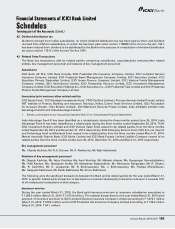
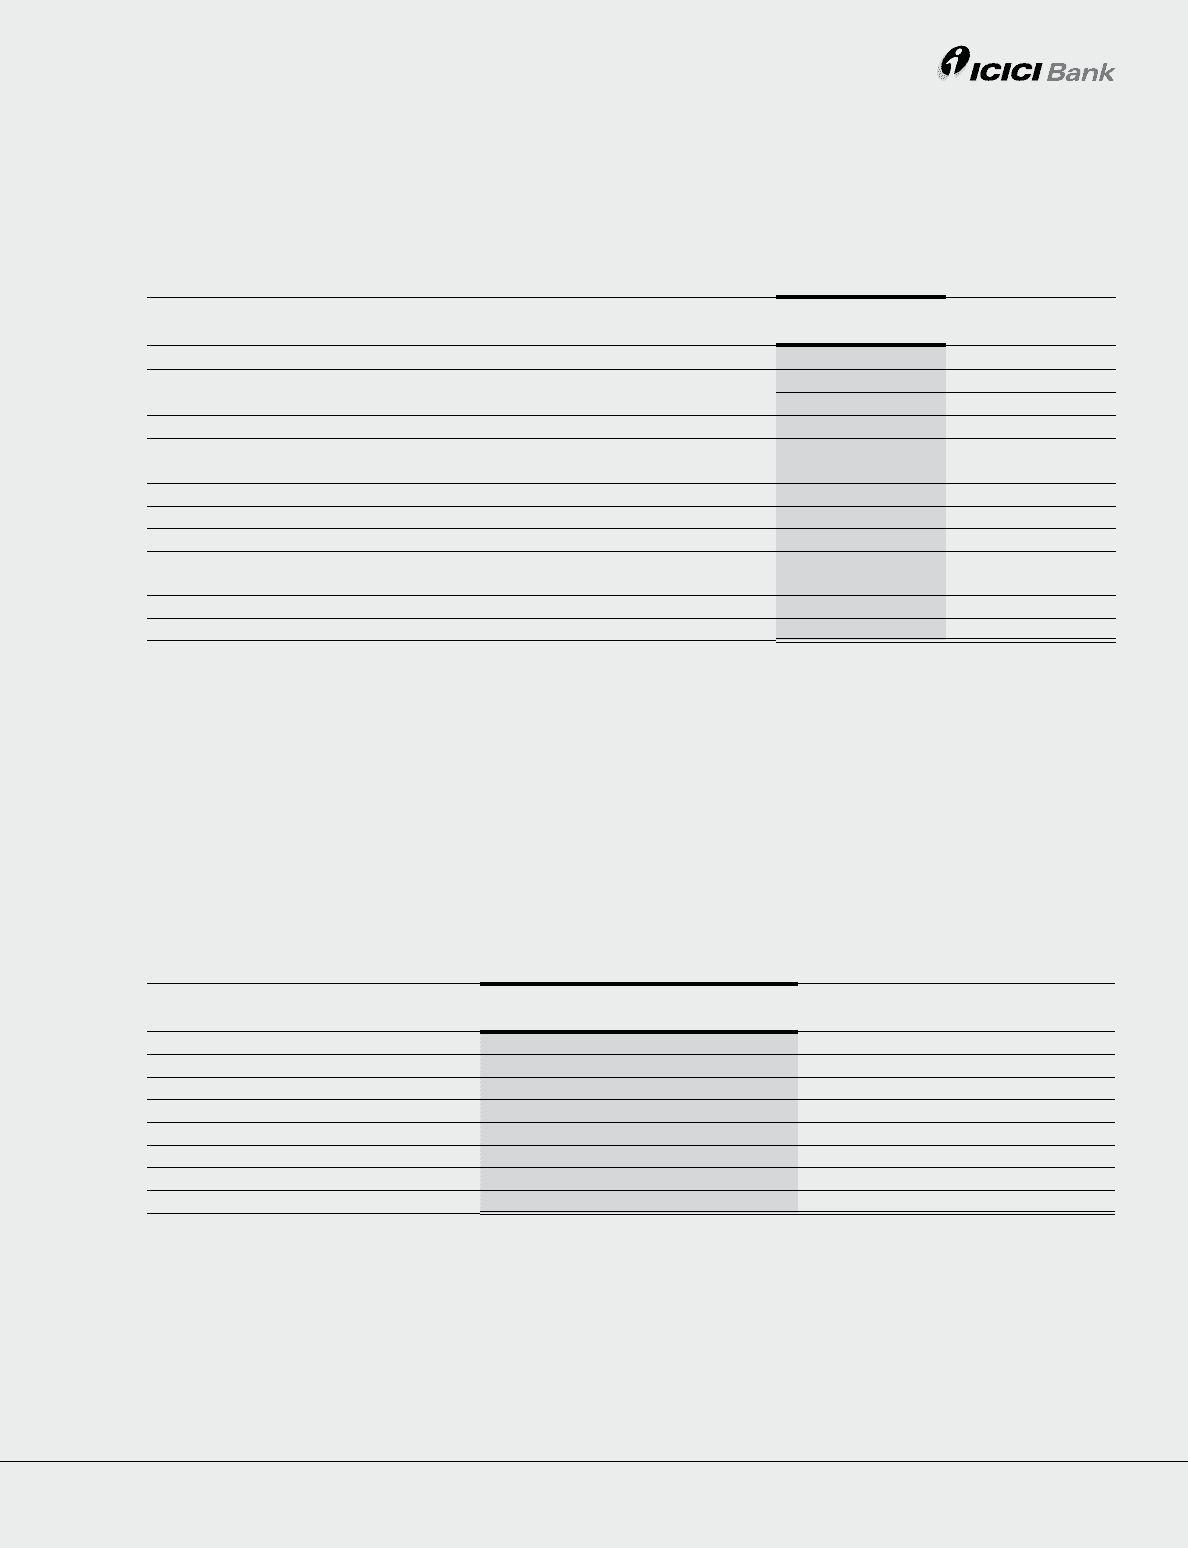
30. Risk category-wise country exposure
As per the extant RBI guidelines, the country exposure of the Bank is categorised into various risk categories listed in
the following table. The funded country exposure (net) of the Bank as a percentage of total funded assets for Singapore
was 1.31% (March 31, 2014: 1.45%) and USA was 2.53% (March 31, 2014: 0.83%). As the net funded exposure to
Singapore and USA exceeds 1.0% of total funded assets, the Bank held a provision of ` 345.0 million on country
exposure at March 31, 2015 (March 31, 2014: ` 135.0 million) based on RBI guidelines.
The following table sets forth, for the periods indicated, the details of exposure (net) and provision held by the bank.
` in million
Risk category Exposure (net) at
March 31, 2015
Provision held at
March 31, 2015
Exposure (net) at
March 31, 2014
Provision held at
March 31, 2014
Insignificant 784,254.1 345.0 713,811.9 135.0
Low 189,069.3 – 158,427.8 –
Moderately Low 27,593.9 – 73,278.3 –
Moderate 10,823.3 – – –
Moderately High ––– –
High ––– –
Very High ––– –
Total 1,011,740.6 345.0 945,518.0 135.0
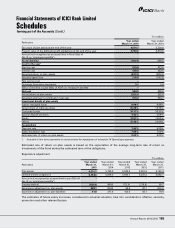
31. Details of Single Borrower Limit and Borrower Group Limit exceeded by the Bank
During the year ended March 31, 2015 and March 31, 2014, the Bank has complied with the Reserve Bank of India
guidelines on single borrower and borrower group limit.
32. Unsecured advances against intangible assets
The Bank has not made advances against intangible collaterals of the borrowers, which are classified as ‘unsecured’
in its financial statements at March 31, 2015 (March 31, 2014: Nil) and the estimated value of the intangible collaterals
was Nil at March 31, 2015 (March 31, 2014: Nil).