ICICI Bank 2015 Annual Report Download - page 220
Download and view the complete annual report
Please find page 220 of the 2015 ICICI Bank annual report below. You can navigate through the pages in the report by either clicking on the pages listed below, or by using the keyword search tool below to find specific information within the annual report.-
 1
1 -
2
-
3
-
4
-
5
-
6
-
7
-
8
-
9
-
10
-
11
-
12
-
13
-
14
-
15
-
16
-
17
-
18
-
19
-
20
-
21
-
22
-
23
-
24
-
25
-
26
-
27
-
28
-
29
-
30
-
31
-
32
-
33
-
34
-
35
-
36
-
37
-
38
-
39
-
40
-
41
-
42
-
43
-
44
-
45
-
46
-
47
-
48
-
49
-
50
-
51
-
52
-
53
-
54
-
55
-
56
-
57
-
58
-
59
-
60
-
61
-
62
-
63
-
64
-
65
-
66
-
67
-
68
-
69
-
70
-
71
-
72
-
73
-
74
-
75
-
76
-
77
-
78
-
79
-
80
-
81
-
82
-
83
-
84
-
85
-
86
-
87
-
88
-
89
-
90
-
91
-
92
-
93
-
94
-
95
-
96
-
97
-
98
-
99
-
100
-
101
-
102
-
103
-
104
-
105
-
106
-
107
-
108
-
109
-
110
-
111
-
112
-
113
-
114
-
115
-
116
-
117
-
118
-
119
-
120
-
121
-
122
-
123
-
124
-
125
-
126
-
127
-
128
-
129
-
130
-
131
-
132
-
133
-
134
-
135
-
136
-
137
-
138
-
139
-
140
-
141
-
142
-
143
-
144
-
145
-
146
-
147
-
148
-
149
-
150
-
151
-
152
-
153
-
154
-
155
-
156
-
157
-
158
-
159
-
160
-
161
-
162
-
163
-
164
-
165
-
166
-
167
-
168
-
169
-
170
-
171
-
172
-
173
-
174
-
175
-
176
-
177
-
178
-
179
-
180
-
181
-
182
-
183
-
184
-
185
-
186
-
187
-
188
-
189
-
190
-
191
-
192
-
193
-
194
-
195
-
196
-
197
-
198
-
199
-
200
-
201
-
202
-
203
-
204
-
205
-
206
-
207
-
208
-
209
-
 210
210 -
 211
211 -
 212
212 -
 213
213 -
 214
214 -
 215
215 -
 216
216 -
 217
217 -
 218
218 -
 219
219 -
 220
220 -
 221
221 -
 222
222 -
 223
223 -
 224
224 -
 225
225 -
 226
226 -
 227
227 -
 228
228 -
 229
229 -
 230
230 -
231
-
232
-
233
-
234
-
235
-
236
 |
 |
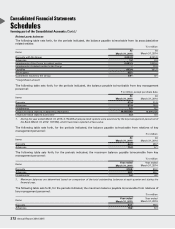
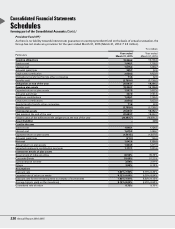
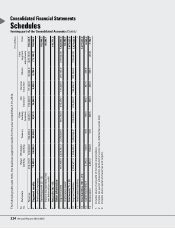
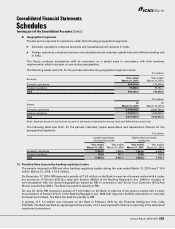
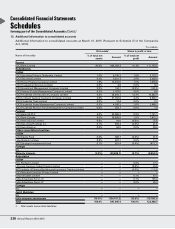
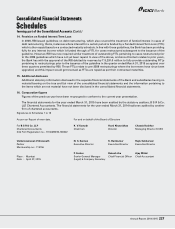
Schedules
forming part of the Consolidated Accounts (Contd.)
218 Annual Report 2014-2015
Consolidated Financial Statements
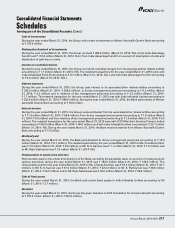
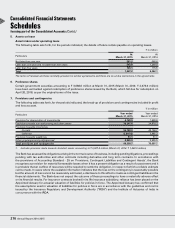
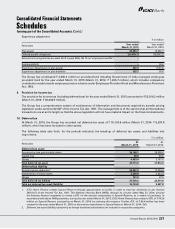
Estimated rate of return on plan assets is based on our expectation of the average long-term rate of return on
investments of the Fund during the estimated term of the obligations.
Experience adjustment
` in million
Particulars
Year ended
March 31,
2015
Year ended
March 31,
2014
Year ended
March 31,
2013
Year ended
March 31,
2012
Year ended
March 31,
2011
Plan assets 10,103.4 9,018.8 9,526.8 9,379.5 8,467.4
Defined benefit obligations (12,999.9) (10,209.9) (10,392.5) (9,602.7) (8,842.9)
Amount not recognised as an asset (limit in para
59(b) of AS 15 on ‘employee benefits’)
– – – – –
Surplus/(deficit) (2,896.5) (1,191.1) (865.7) (223.2) (375.5)
Experience adjustment on plan assets 104.7 (29.1) 102.3 51.7 69.1
Experience adjustment on plan liabilities 1,271.2 2,549.6 1,525.2 2,692.3 689.7
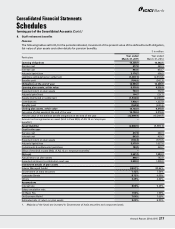
Gratuity
The following table sets forth, for the periods indicated, movement of the present value of the defined benefit obligation, fair value
of plan assets and other details for gratuity benefits of the Group.
` in million
Particulars Year ended
March 31, 2015
Year ended
March 31, 2014
Defined benefit obligation liability
Opening obligations 7,252.6 6,887.3
Add: Adjustment for exchange fluctuation on opening obligation 3.1 5.8
Adjusted opening obligations 7,255.7 6,893.1
Service cost 716.1 649.0
Interest cost 662.8 557.3
Actuarial (gain)/loss 643.5 (93.5)
Past service cost ––
Obligations transferred from/to other companies (15.6) (2.0)
Benefits paid (792.3) (751.3)
Obligations at the end of year 8,470.2 7,252.6
Opening plan assets, at fair value 6,744.3 6,394.9
Expected return on plan assets 518.6 493.3
Actuarial gain/(loss) 699.4 (8.4)
Contributions 708.3 617.8
Assets transfer from/to other companies (15.6) (2.0)
Benefits paid (792.3) (751.3)
Closing plan assets, at fair value 7,862.7 6,744.3
Fair value of plan assets at the end of the year 7,862.7 6,744.3
Present value of the defined benefit obligations at the end of the year (8,470.2) (7,252.6)
Unrecognised past service cost ––
Amount not recognised as an asset (limit in para 59(b) of AS 15 on ‘employee
benefits’) –(0.1)
Asset/(liability) (607.5) (508.4)
Cost for the year
Service cost 716.1 649.0
Interest cost 662.8 557.3