ICICI Bank 2015 Annual Report Download - page 7
Download and view the complete annual report
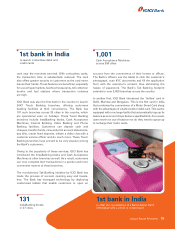
Please find page 7 of the 2015 ICICI Bank annual report below. You can navigate through the pages in the report by either clicking on the pages listed below, or by using the keyword search tool below to find specific information within the annual report.-
 1
1 -
 2
2 -
 3
3 -
 4
4 -
 5
5 -
 6
6 -
 7
7 -
 8
8 -
 9
9 -
 10
10 -
 11
11 -
 12
12 -
 13
13 -
 14
14 -
 15
15 -
 16
16 -
 17
17 -
 18
18 -
19
-
20
-
21
-
22
-
23
-
24
-
25
-
26
-
27
-
28
-
29
-
30
-
31
-
32
-
33
-
34
-
35
-
36
-
37
-
38
-
39
-
40
-
41
-
42
-
43
-
44
-
45
-
46
-
47
-
48
-
49
-
50
-
51
-
52
-
53
-
54
-
55
-
56
-
57
-
58
-
59
-
60
-
61
-
62
-
63
-
64
-
65
-
66
-
67
-
68
-
69
-
70
-
71
-
72
-
73
-
74
-
75
-
76
-
77
-
78
-
79
-
80
-
81
-
82
-
83
-
84
-
85
-
86
-
87
-
88
-
89
-
90
-
91
-
92
-
93
-
94
-
95
-
96
-
97
-
98
-
99
-
100
-
101
-
102
-
103
-
104
-
105
-
106
-
107
-
108
-
109
-
110
-
111
-
112
-
113
-
114
-
115
-
116
-
117
-
118
-
119
-
120
-
121
-
122
-
123
-
124
-
125
-
126
-
127
-
128
-
129
-
130
-
131
-
132
-
133
-
134
-
135
-
136
-
137
-
138
-
139
-
140
-
141
-
142
-
143
-
144
-
145
-
146
-
147
-
148
-
149
-
150
-
151
-
152
-
153
-
154
-
155
-
156
-
157
-
158
-
159
-
160
-
161
-
162
-
163
-
164
-
165
-
166
-
167
-
168
-
169
-
170
-
171
-
172
-
173
-
174
-
175
-
176
-
177
-
178
-
179
-
180
-
181
-
182
-
183
-
184
-
185
-
186
-
187
-
188
-
189
-
190
-
191
-
192
-
193
-
194
-
195
-
196
-
197
-
198
-
199
-
200
-
201
-
202
-
203
-
204
-
205
-
206
-
207
-
208
-
209
-
210
-
211
-
212
-
213
-
214
-
215
-
216
-
217
-
218
-
219
-
220
-
221
-
222
-
223
-
224
-
225
-
226
-
227
-
228
-
229
-
230
-
231
-
232
-
233
-
234
-
235
-
236
 |
 |
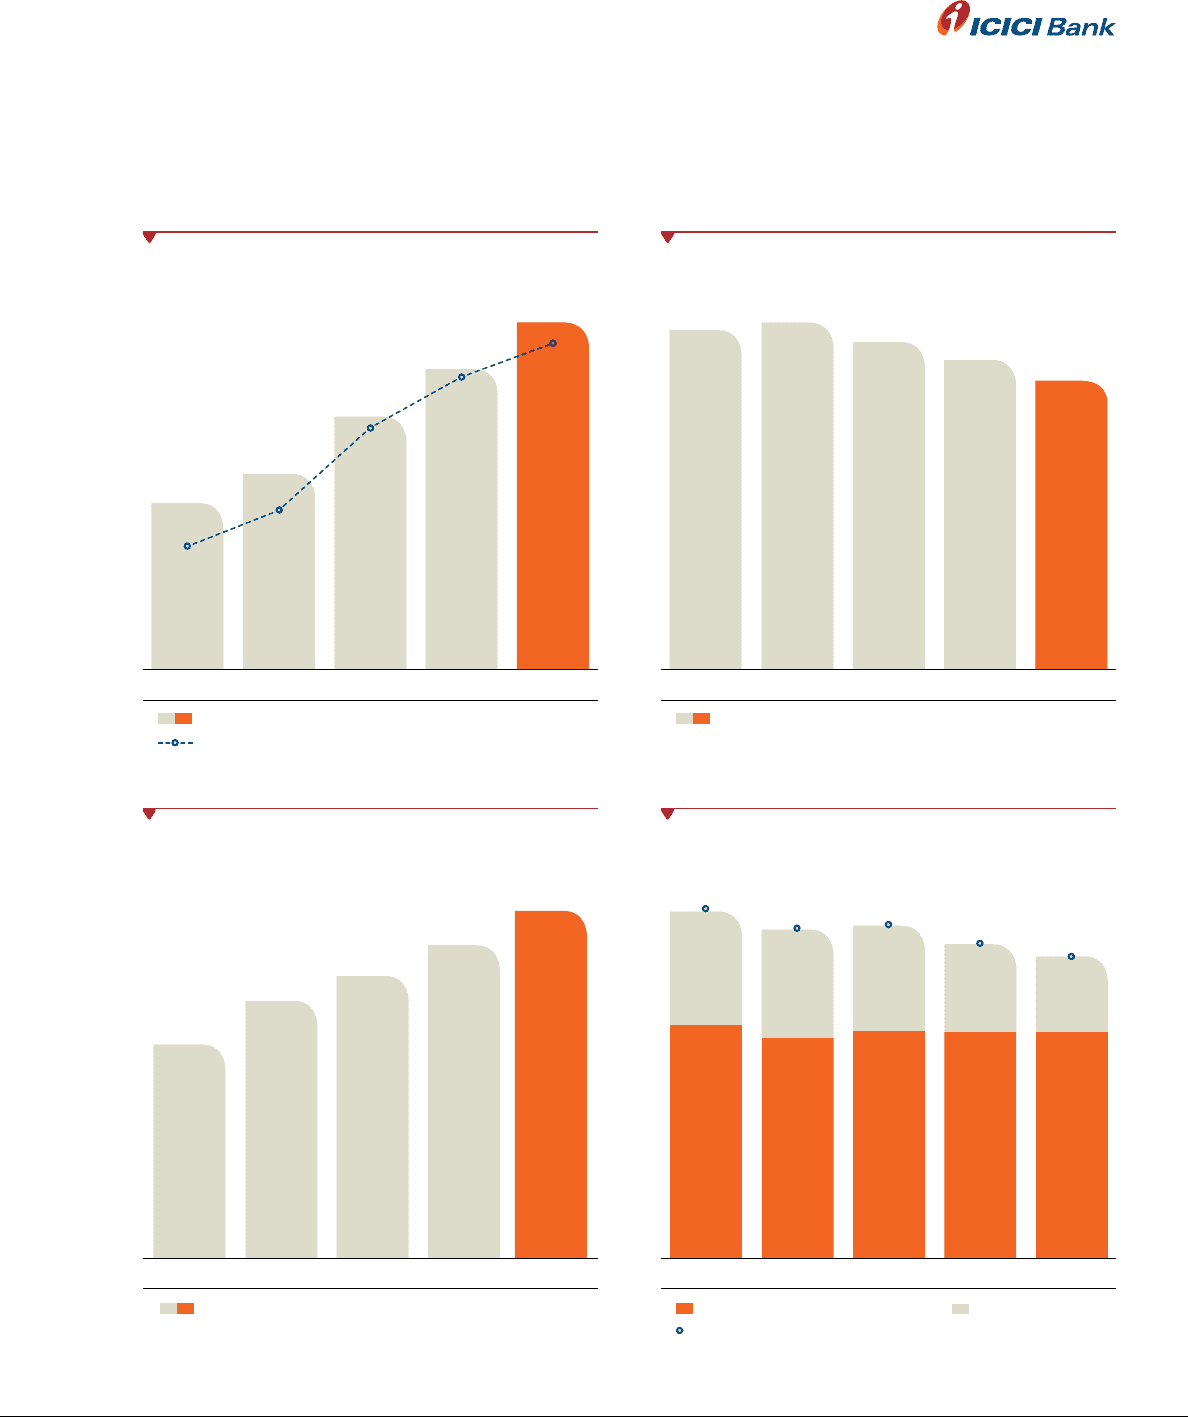
Total Assets (` in billion)
Total Assets
4,062.34
4,890.69 5,367.95
5,946.42
6,461.29
FY2011 FY2012 FY2013 FY2015FY2014
Cost to Income Ratio
Cost to Income Ratio
41.95% 42.91% 40.49% 38.25% 36.83%
FY2011 FY2012 FY2013 FY2015FY2014
12.68%
5.84%
6.37%
13.17% 12.78%
4.24%
19.54%
18.52% 18.74%
17.70% 17.02%
12.78%
4.92%
12.80%
5.94%
Tier I
Capital Adequacy Ratio
FY20111FY20121FY20131FY20152
FY20142
1. In accordance with Basel II guidelines of RBI
2. In accordance with Basel III guidelines of RBI
Tier II
Total
Net Income Margin (NIM)
Net Interest Income (NII) (` in billion)
NII & NIM
2.64%
2.73%
3.11%
3.33%
3.48%
FY2011 FY2012 FY2013 FY2015FY2014
90.17 107.34
138.66
164.75
190.40
5Annual Report 2014-2015