American Airlines 2012 Annual Report Download - page 101
Download and view the complete annual report
Please find page 101 of the 2012 American Airlines annual report below. You can navigate through the pages in the report by either clicking on the pages listed below, or by using the keyword search tool below to find specific information within the annual report.-
 1
1 -
2
-
3
-
4
-
5
-
6
-
7
-
8
-
9
-
10
-
11
-
12
-
13
-
14
-
15
-
16
-
17
-
18
-
19
-
20
-
21
-
22
-
23
-
24
-
25
-
26
-
27
-
28
-
29
-
30
-
31
-
32
-
33
-
34
-
35
-
36
-
37
-
38
-
39
-
40
-
41
-
42
-
43
-
44
-
45
-
46
-
47
-
48
-
49
-
50
-
51
-
52
-
53
-
54
-
55
-
56
-
57
-
58
-
59
-
60
-
61
-
62
-
63
-
64
-
65
-
66
-
67
-
68
-
69
-
70
-
71
-
72
-
73
-
74
-
75
-
76
-
77
-
78
-
79
-
80
-
81
-
82
-
83
-
84
-
85
-
86
-
87
-
88
-
89
-
90
-
 91
91 -
 92
92 -
 93
93 -
 94
94 -
 95
95 -
 96
96 -
 97
97 -
 98
98 -
 99
99 -
 100
100 -
 101
101 -
 102
102 -
 103
103 -
 104
104 -
 105
105 -
 106
106 -
 107
107 -
 108
108 -
 109
109 -
 110
110 -
 111
111 -
112
-
113
-
114
-
115
-
116
-
117
-
118
-
119
-
120
-
121
-
122
-
123
 |
 |

Table of Contents
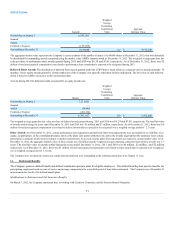
service to over 175 destinations in North America, Mexico and the Caribbean. On a separate company basis, AMR Eagle reported $1.2 billion in revenue in
2012. However, this historical financial information is not indicative of what AMR Eagle’s future revenues might be if AMR Eagle were a stand-alone entity.
In 2012 and 2011, American made payments to the American Eagle carriers of approximately $1.1 billion and $2.4 billion, respectively, related to the capacity purchase agreement. In addition, American
incurred costs associated with generating Regional Affiliates revenue for flights on AMR Eagle of $128 million and $132 million in 2012 and 2011,
respectively, recorded in Commissions, booking fees and credit card expense in the accompanying consolidated statements of operations. American also
incurred other costs in connection with its affiliate relationship with AMR Eagle totaling approximately $1.6 billion and $350 million in 2012 and 2011,
respectively, primarily recorded in Other operating expenses in the accompanying consolidated statements of operations.
In consideration for certain services provided, the AMR Eagle carriers paid American approximately $16 million in 2012, $18 million in 2011 and $18
million in 2010.
American recognizes compensation expense associated with certain AMR common stock-based awards for employees of American (see Note 10). In addition,
American incurs pension and postretirement benefit expense for American employees working at affiliates of the Company. American transfers pension and
postretirement benefit expense for these employees to its affiliates based on a percentage of salaries and cost per employee, respectively (see Note 11).
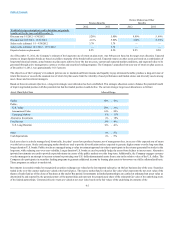
15. Segment Reporting
The Company’s operations of American and AMR Eagle are treated as an integrated route network and the route scheduling system maximizes the operating
results of the Company. The Company’s chief operating decision maker makes resource allocation decisions to maximize the Company’s consolidated
financial results. Based on the way the Company treats the network and the manner in which resource allocation decisions are made, the Company has only
one operating segment for financial reporting purposes consisting of the operations of American and AMR Eagle.
American, together with the American Eagle carriers and the third party carriers that provide regional feed to American, serves more than 250 cities in
approximately 50 countries with, on average, 3,400 daily flights. The combined network fleet numbers approximately 900 aircraft. American is also one of the
largest scheduled air freight carriers in the world, providing a wide range of freight and mail services to shippers throughout its system onboard American’s
passenger fleet.
Revenues from other segments are below the quantitative threshold for determining reportable segments and consist primarily of revenues from Americas
Ground Services, Inc. The difference between the financial information of the Company’s one reportable segment and the financial information included in the
accompanying consolidated statements of operations and balance sheets as a result of these entities is not material.
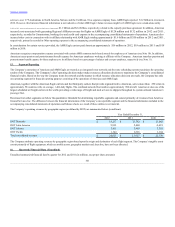
The Company’s operating revenues by geographic region (as defined by DOT) are summarized below (in millions):
Year Ended December 31,
2012
2011
2010
DOT Domestic
$14,257
$ 13,782
$ 13,062
DOT Latin America
5,813
5,460
4,619
DOT Atlantic
3,411
3,499
3,365
DOT Pacific
1,344
1,216
1,104
Total consolidated revenues
$24,825
$23,957
$22,150
The Company attributes operating revenues by geographic region based upon the origin and destination of each flight segment. The Company’s tangible assets
consist primarily of flight equipment, which are mobile across geographic markets and, therefore, have not been allocated.
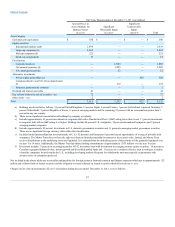
16. Quarterly Financial Data (Unaudited)
Unaudited summarized financial data by quarter for 2012 and 2011 (in millions, except per share amounts):
101