American Airlines 2012 Annual Report Download - page 86
Download and view the complete annual report
Please find page 86 of the 2012 American Airlines annual report below. You can navigate through the pages in the report by either clicking on the pages listed below, or by using the keyword search tool below to find specific information within the annual report.-
 1
1 -
2
-
3
-
4
-
5
-
6
-
7
-
8
-
9
-
10
-
11
-
12
-
13
-
14
-
15
-
16
-
17
-
18
-
19
-
20
-
21
-
22
-
23
-
24
-
25
-
26
-
27
-
28
-
29
-
30
-
31
-
32
-
33
-
34
-
35
-
36
-
37
-
38
-
39
-
40
-
41
-
42
-
43
-
44
-
45
-
46
-
47
-
48
-
49
-
50
-
51
-
52
-
53
-
54
-
55
-
56
-
57
-
58
-
59
-
60
-
61
-
62
-
63
-
64
-
65
-
66
-
67
-
68
-
69
-
70
-
71
-
72
-
73
-
74
-
75
-
 76
76 -
 77
77 -
 78
78 -
 79
79 -
 80
80 -
 81
81 -
 82
82 -
 83
83 -
 84
84 -
 85
85 -
 86
86 -
 87
87 -
 88
88 -
 89
89 -
 90
90 -
 91
91 -
 92
92 -
 93
93 -
 94
94 -
 95
95 -
 96
96 -
97
-
98
-
99
-
100
-
101
-
102
-
103
-
104
-
105
-
106
-
107
-
108
-
109
-
110
-
111
-
112
-
113
-
114
-
115
-
116
-
117
-
118
-
119
-
120
-
121
-
122
-
123
 |
 |

Table of Contents
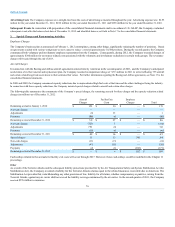
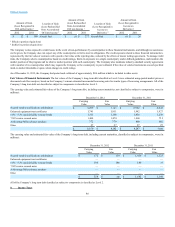
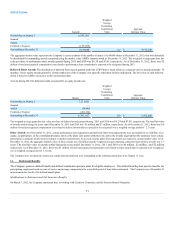
Amount of Gain
(Loss) Recognized in
OCI on Derivative1
Location of Gain
(Loss) Reclassified
from Accumulated
OCI into Income 1
Amount of Gain
(Loss) Reclassified
from Accumulated
OCI into Income 1
Location of Gain
(Loss) Recognized in
Income on
Derivative 2
Amount of Gain
(Loss) Recognized in
Income on
Derivative 2
2012
2011
2012
2011
2012
2011
$ 12
$ 190
Aircraft Fuel
$(3)
$ 277
Aircraft Fuel
$(1)
$24
1 Effective portion of gain (loss)
2 Ineffective portion of gain (loss)
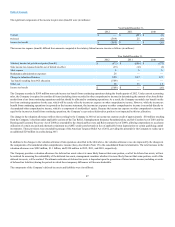
The Company is also exposed to credit losses in the event of non-performance by counterparties to these financial instruments, and although no assurances
can be given, the Company does not expect any of the counterparties to fail to meet its obligations. The credit exposure related to these financial instruments is
represented by the fair value of contracts with a positive fair value at the reporting date, reduced by the effects of master netting agreements. To manage credit
risks, the Company selects counterparties based on credit ratings, limits its exposure to a single counterparty under defined guidelines, and monitors the
market position of the program and its relative market position with each counterparty. The Company also maintains industry-standard security agreements
with a number of its counterparties which may require the Company or the counterparty to post collateral if the value of selected instruments exceed specified
mark-to-market thresholds or upon certain changes in credit ratings.
As of December 31, 2012, the Company had posted cash collateral of approximately $0.6 million which is included in other assets.
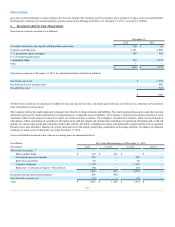
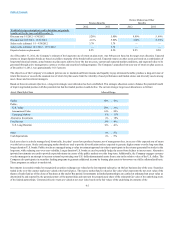
Fair Values of Financial Instruments The fair values of the Company’s long-term debt classified as Level 2 were estimated using quoted market prices or
discounted cash flow analyses, based on the Company’s current estimated incremental borrowing rates for similar types of borrowing arrangements. All of the
Company’s long term debt not classified as subject to compromise is classified as Level 2.
The carrying value and estimated fair values of the Company’s long-term debt, including current maturities, not classified as subject to compromise, were (in
millions):
December 31, 2012
December 31, 2011
Carrying
Value
Fair
Value
Carrying
Value
Fair
Value
Secured variable and fixed rate indebtedness
$3,297
$3,143
$2,952
$2,647
Enhanced equipment trust certificates
1,741
1,811
1,942
1,927
6.0% - 8.5% special facility revenue bonds
1,313
1,308
1,436
1,230
7.50% senior secured notes 1,000
1,074
1,000
711
AAdvantage Miles advance purchase
772
779
890
902
Other
27
27
27
27
$8,150
$ 8,142
$ 8,247
$7,444
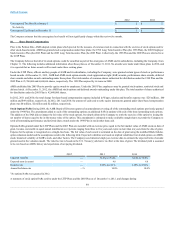
The carrying value and estimated fair value of the Company’s long-term debt, including current maturities, classified as subject to compromise, were (in
millions):
December 31, 2012
December 31, 2011
Carrying
Value
Fair
Value
Carrying
Value
Fair
Value
Secured variable and fixed rate indebtedness
$ 172
$ 154
$1,456
$ 1,123
Enhanced equipment trust certificates
—
—
—
—
6.0% - 8.5% special facility revenue bonds
186
186
186
37
7.50% senior secured notes
—
—
—
—
AAdvantage Miles advance purchase
—
—
—
—
Other
—
—
—
—
$ 358
$340
$1,642
$1,160
All of the Company’s long term debt classified as subject to compromise is classified as Level 2.
9. Income Taxes
86