American Airlines 2012 Annual Report Download - page 77
Download and view the complete annual report
Please find page 77 of the 2012 American Airlines annual report below. You can navigate through the pages in the report by either clicking on the pages listed below, or by using the keyword search tool below to find specific information within the annual report.-
 1
1 -
2
-
3
-
4
-
5
-
6
-
7
-
8
-
9
-
10
-
11
-
12
-
13
-
14
-
15
-
16
-
17
-
18
-
19
-
20
-
21
-
22
-
23
-
24
-
25
-
26
-
27
-
28
-
29
-
30
-
31
-
32
-
33
-
34
-
35
-
36
-
37
-
38
-
39
-
40
-
41
-
42
-
43
-
44
-
45
-
46
-
47
-
48
-
49
-
50
-
51
-
52
-
53
-
54
-
55
-
56
-
57
-
58
-
59
-
60
-
61
-
62
-
63
-
64
-
65
-
66
-
 67
67 -
 68
68 -
 69
69 -
 70
70 -
 71
71 -
 72
72 -
 73
73 -
 74
74 -
 75
75 -
 76
76 -
 77
77 -
 78
78 -
 79
79 -
 80
80 -
 81
81 -
 82
82 -
 83
83 -
 84
84 -
 85
85 -
 86
86 -
 87
87 -
88
-
89
-
90
-
91
-
92
-
93
-
94
-
95
-
96
-
97
-
98
-
99
-
100
-
101
-
102
-
103
-
104
-
105
-
106
-
107
-
108
-
109
-
110
-
111
-
112
-
113
-
114
-
115
-
116
-
117
-
118
-
119
-
120
-
121
-
122
-
123
 |
 |
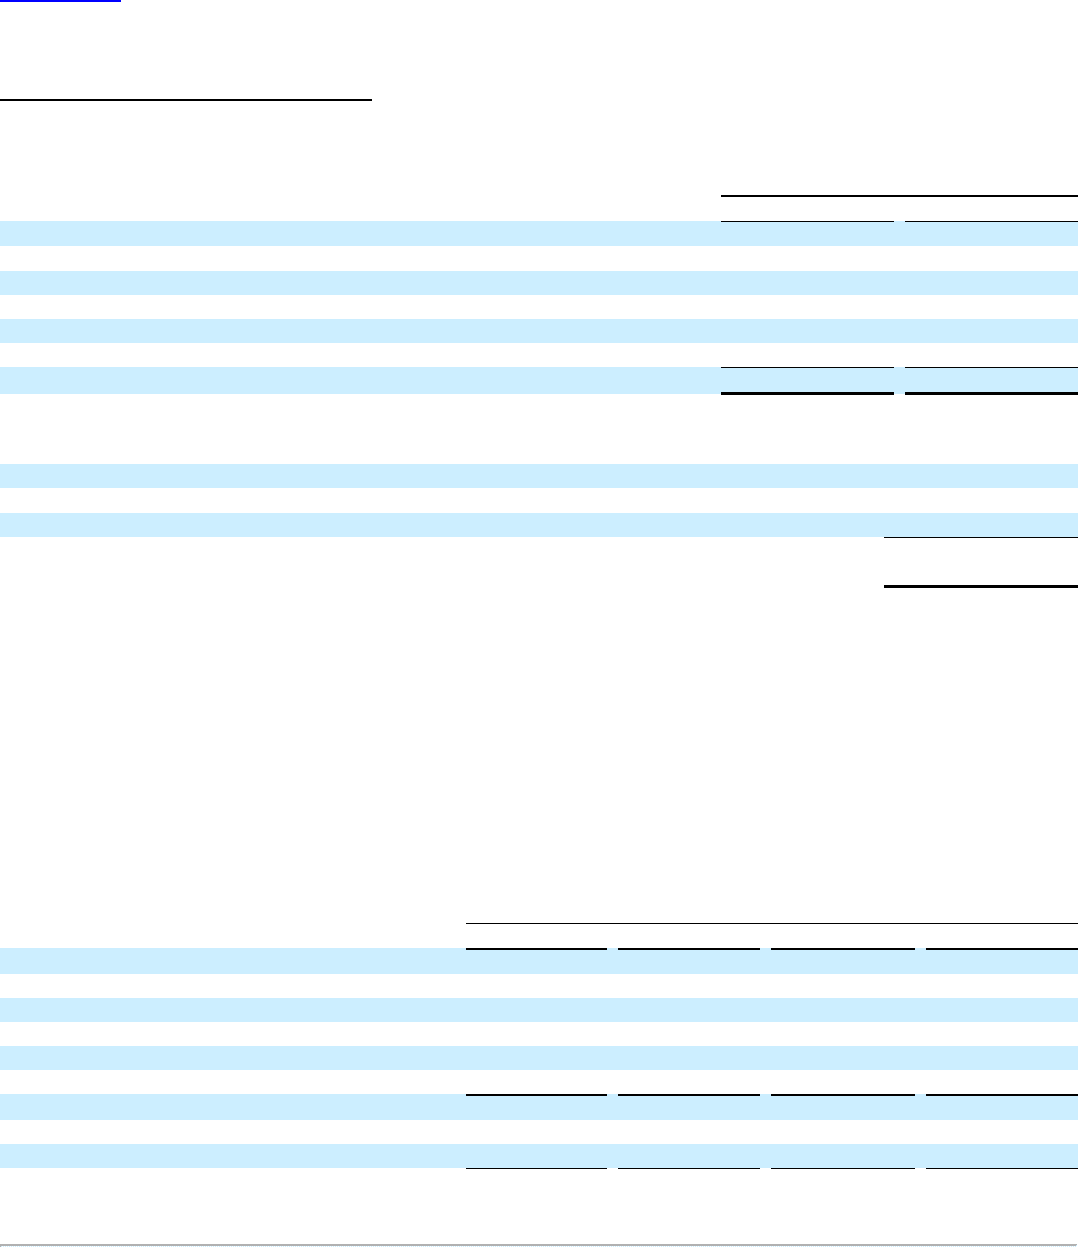
Table of Contents
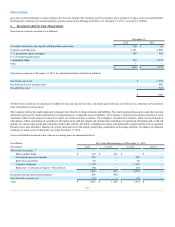
proceeds as partial settlement of claims related to the Terrorist Attacks. The Company used these funds to pay a portion of its share of the associated liability.
Reflecting this settlement, the remaining liability, and the amount of the offsetting receivable as of December 31, 2012, were each $1.1 billion.
4. Investments and Fair Value Measurements
Short-term investments consisted of (in millions):
December 31,
2012
2011
Overnight investments, time deposits and Repurchase agreements
$306
$130
Corporate and bank notes
2,121
1,808
U. S. government agency mortgages
545
502
U.S. government agency notes
—
Commingled funds
435
1,274
Other
1
—
$3,408
$3,714
Short-term investments at December 31, 2012, by contractual maturity included (in millions):
Due in one year or less $2,258
Due between one year and three years 605
Due after three years 545
$3,408
All short-term investments are classified as available-for-sale and stated at fair value. Unrealized gains and losses are reflected as a component of Accumulated
other comprehensive income (loss).
The Company utilizes the market approach to measure fair value for its financial assets and liabilities. The market approach uses prices and other relevant
information generated by market transactions involving identical or comparable assets or liabilities. The Company’s short-term investments classified as Level
2 primarily utilize broker quotes in a non-active market for valuation of these securities. The Company’s fuel derivative contracts, which consist primarily of
call options, collars (consisting of a purchased call option and a sold put option) and call spreads (consisting of a purchased call option and a sold call
option), are valued using energy and commodity market data which is derived by combining raw inputs with quantitative models and processes to generate
forward curves and volatilities. Heating oil, jet fuel and crude oil are the primary underlying commodities in the hedge portfolio. No changes in valuation
techniques or inputs occurred during the year ended December 31, 2012.
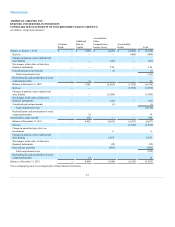
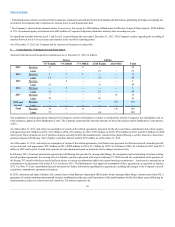
Assets and liabilities measured at fair value on a recurring basis are summarized below:
(in millions)
Fair Value Measurements as of December 31, 2012
Description
Total
Level 1
Level 2
Level 3
Short-term investments 1, 2
Money market funds
$436
$436
$ —
$ —
Government agency investments
545
—
545
—
Repurchase agreements
304
—
304
—
Corporate obligations
1,519
—
1,519
—
Bank notes / Certificates of deposit / Time deposits
604
—
604
—
3,408
436
2,972
—
Restricted cash and short-term investments 1
850
850
—
—
Fuel derivative contracts, net 1
65
—
65
—
Total
$4,323
$1,286
$3,037
$ —
77