American Airlines 2012 Annual Report Download - page 95
Download and view the complete annual report
Please find page 95 of the 2012 American Airlines annual report below. You can navigate through the pages in the report by either clicking on the pages listed below, or by using the keyword search tool below to find specific information within the annual report.-
 1
1 -
2
-
3
-
4
-
5
-
6
-
7
-
8
-
9
-
10
-
11
-
12
-
13
-
14
-
15
-
16
-
17
-
18
-
19
-
20
-
21
-
22
-
23
-
24
-
25
-
26
-
27
-
28
-
29
-
30
-
31
-
32
-
33
-
34
-
35
-
36
-
37
-
38
-
39
-
40
-
41
-
42
-
43
-
44
-
45
-
46
-
47
-
48
-
49
-
50
-
51
-
52
-
53
-
54
-
55
-
56
-
57
-
58
-
59
-
60
-
61
-
62
-
63
-
64
-
65
-
66
-
67
-
68
-
69
-
70
-
71
-
72
-
73
-
74
-
75
-
76
-
77
-
78
-
79
-
80
-
81
-
82
-
83
-
84
-
 85
85 -
 86
86 -
 87
87 -
 88
88 -
 89
89 -
 90
90 -
 91
91 -
 92
92 -
 93
93 -
 94
94 -
 95
95 -
 96
96 -
 97
97 -
 98
98 -
 99
99 -
 100
100 -
 101
101 -
 102
102 -
 103
103 -
 104
104 -
 105
105 -
106
-
107
-
108
-
109
-
110
-
111
-
112
-
113
-
114
-
115
-
116
-
117
-
118
-
119
-
120
-
121
-
122
-
123
 |
 |

Table of Contents
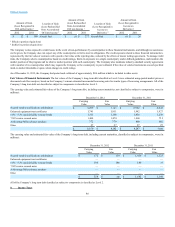
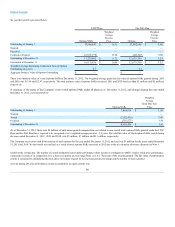
Pension Benefits
Retiree Medical and Other
Benefits
2012
2011
2012
2011
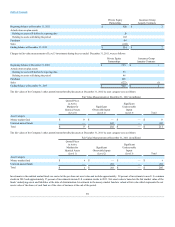
Weighted-average assumptions used to determine net periodic
benefit cost for the years ended December 31
Discount rate 1/1/2012 - 9/30/2012
5.20%
5.80%
4.89%
5.69%
Discount rate 10/1/2012 - 12/31/2012
4.10%
5.80%
3.80%
5.69%
Salary scale (ultimate) 1/1 - 9/30/2012
3.78
3.78
—
—
Salary scale (ultimate) 10/1/2012 - 12/31/2012
—
3.78
—
—
Expected return on plan assets
8.25
8.50
8.25
8.50
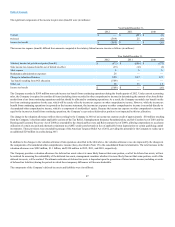
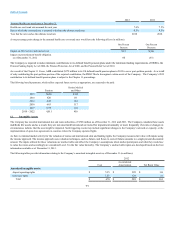
As of December 31, 2012, the Company’s estimate of the long-term rate of return on plan assets was 8.00 percent based on the target asset allocation. Expected
returns on longer duration bonds are based on yields to maturity of the bonds held at year-end. Expected returns on other assets are based on a combination of
long-term historical returns, actual returns on plan assets achieved over the last ten years, current and expected market conditions, and expected value to be
generated through active management, currency overlay and securities lending programs. The Company’s annualized ten-year rate of return on plan assets as
of December 31, 2012, was approximately 10.15 percent.
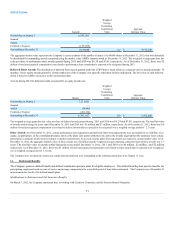
The objectives of the Company’s investment policies are to: maintain sufficient income and liquidity to pay retirement benefits; produce a long-term rate of
return that meets or exceeds the assumed rate of return for plan assets; limit the volatility of asset performance and funded status; and diversify assets among
asset classes and investment managers.
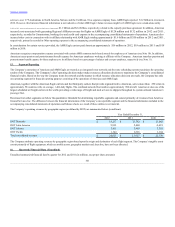
Based on these investment objectives, a long-term strategic asset allocation has been established. This strategic allocation seeks to balance the potential benefit
of improving funded position with the potential risk that the funded position would decline. The current strategic target asset allocation is as follows:
Asset Class/Sub-Class
Allowed Range
Equity
60%-70%
Public:
U.S. Value
18%-33%
International Value
14%-24%
Emerging Markets
5%-11%
Alternative Investments
0%-18%
Fixed Income
30%-40%
U.S. Long Duration
30%-40%
Other
0%-5%
Cash Equivalents
0%-5%
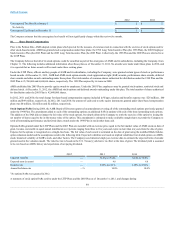
Each asset class is actively managed and, historically, the plans’ assets have produced returns, net of management fees, in excess of the expected rate of return
over the last ten years. Stocks and emerging market bonds are used to provide diversification and are expected to generate higher returns over the long-term than
longer duration U.S. bonds. Public stocks are managed using a value investment approach in order to participate in the returns generated by stocks in the
long-term, while reducing year-over-year volatility. Longer duration U.S. bonds are used to partially hedge the assets from declines in interest rates. Alternative
(private) investments are used to provide expected returns in excess of the public markets over the long-term. Additionally, the Company engages currency
overlay managers in an attempt to increase returns by protecting non-U.S. dollar denominated assets from a rise in the relative value of the U.S. dollar. The
Company also participates in securities lending programs to generate additional income by loaning plan assets to borrowers on a fully collateralized basis.
These programs are subject to market risk.
Investments in securities traded on recognized securities exchanges are valued at the last reported sales price on the last business day of the year. Securities
traded in the over-the-counter market are valued at the last bid price. The money market fund is valued at fair value which represents the net asset value of the
shares of such fund as of the close of business at the end of the period. Investments in limited partnerships are carried at estimated net asset value as
determined by and reported by the general partners of the partnerships and represent the proportionate share of the estimated fair value of the underlying assets
of the limited partnerships. Common/collective trusts are valued at net asset value based on the fair values of the underlying investments of the
95