American Airlines 2012 Annual Report Download - page 49
Download and view the complete annual report
Please find page 49 of the 2012 American Airlines annual report below. You can navigate through the pages in the report by either clicking on the pages listed below, or by using the keyword search tool below to find specific information within the annual report.-
 1
1 -
2
-
3
-
4
-
5
-
6
-
7
-
8
-
9
-
10
-
11
-
12
-
13
-
14
-
15
-
16
-
17
-
18
-
19
-
20
-
21
-
22
-
23
-
24
-
25
-
26
-
27
-
28
-
29
-
30
-
31
-
32
-
33
-
34
-
35
-
36
-
37
-
38
-
 39
39 -
 40
40 -
 41
41 -
 42
42 -
 43
43 -
 44
44 -
 45
45 -
 46
46 -
 47
47 -
 48
48 -
 49
49 -
 50
50 -
 51
51 -
 52
52 -
 53
53 -
 54
54 -
 55
55 -
 56
56 -
 57
57 -
 58
58 -
 59
59 -
60
-
61
-
62
-
63
-
64
-
65
-
66
-
67
-
68
-
69
-
70
-
71
-
72
-
73
-
74
-
75
-
76
-
77
-
78
-
79
-
80
-
81
-
82
-
83
-
84
-
85
-
86
-
87
-
88
-
89
-
90
-
91
-
92
-
93
-
94
-
95
-
96
-
97
-
98
-
99
-
100
-
101
-
102
-
103
-
104
-
105
-
106
-
107
-
108
-
109
-
110
-
111
-
112
-
113
-
114
-
115
-
116
-
117
-
118
-
119
-
120
-
121
-
122
-
123
 |
 |

Results of Operations
Revenues
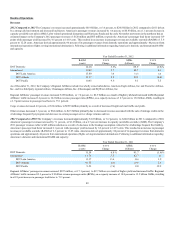
2012 Compared to 2011 The Company’s revenues increased approximately $0.9 billion, or 3.6 percent, to $24.8 billion in 2012 compared to 2011 driven
by a strong yield environment and increased load factors. American’s passenger revenues increased by 4.4 percent, or $0.8 billion, on a 1.1 percent decrease in
capacity (available seat mile) (ASM). Labor related operational disruptions and Hurricane Sandy and the early November snowstorm in the northeast had an
estimated impact on the Company's 2012 passenger revenues of $120 million and $65 million, respectively. American’s passenger load factor increased 0.9
points while passenger yield increased by 4.5 percent to 14.83 cents. This resulted in an increase in passenger revenue per available seat mile (RASM) of 5.6
percent to 12.28 cents. American derived approximately 60 percent of its passenger revenues from domestic operations and approximately 40 percent from
international operations (flights serving international destinations). Following is additional information regarding American’s domestic and international RASM
and capacity:
Year Ended December 31, 2012
RASM
(cents)
Y-O-Y
Change
ASMs
(billions)
Y-O-Y
Change
DOT Domestic 12.18
5.5%
89.9
(1.9)%
International 12.42
5.7
62.7
0.1
DOT Latin America 13.89
3.8
31.3
4.4
DOT Atlantic 11.17
5.9
22.3
(6.6)
DOT Pacific 10.45
9.6
9.1
3.5
As of December 31, 2012, the Company’s Regional Affiliates include two wholly owned subsidiaries, American Eagle Airlines, Inc. and Executive Airlines,
Inc., and two third party regional airlines, Chautauqua Airlines, Inc. (Chautauqua) and SkyWest Airlines, Inc.
Regional Affiliates’ passenger revenues increased $190 million, or 7.0 percent, to $2.9 billion as a result of higher yield and increased traffic.Regional
Affiliates’ traffic increased 3.2 percent to 10.2 billion revenue passenger miles (RPMs), on a capacity increase of 0.7 percent to 13.6 billion ASMs, resulting in
a 1.9 point increase in passenger load factor to 75.1 percent.
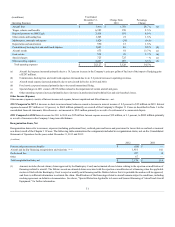
Cargo revenues decreased 4.8 percent, or $34 million, to $669 million primarily as a result of decreased freight and mail traffic and yields.
Other revenues decreased 3.3 percent, or $84 million, to $2.5 billion primarily due to decreased revenue associated with the sale of mileage credits in the
AAdvantage frequent flyer program and decreases in certain passenger service charge volumes and fees.
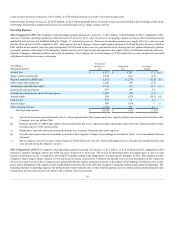
2011 Compared to 2010 The Company’s revenues increased approximately $1.8 billion, or 8.2 percent, to $24.0 billion in 2011 compared to 2010.
American’s passenger revenues increased by 7.1 percent, or $1.2 billion, on a 0.7 percent increase in capacity (available seat mile) (ASM). The Company’s
2011 passenger revenues reflect a $43 million reduction as a result of a decrease in the breakage assumption related to the AAdvantage frequent flier liability.
American’s passenger load factor increased 0.1 percent while passenger yield increased by 6.2 percent to 14.19 cents. This resulted in an increase in passenger
revenue per available seat mile (RASM) of 6.3 percent to 11.63 cents. American derived approximately 60 percent of its passenger revenues from domestic
operations and approximately 40 percent from international operations (flights serving international destinations). Following is additional information regarding
American’s domestic and international RASM and capacity:
Year Ended December 31, 2011
RASM
(cents)
Y-O-Y
Change
ASMs
(billions)
Y-O-Y
Change
DOT Domestic 11.54
6.8 %
91.7
(1.6)%
International 11.76
5.5
62.7
4.3
DOT Latin America 13.37
13.4
30.0
1.9
DOT Atlantic 10.55
(0.3)
23.8
2.6
DOT Pacific 9.53
(7.4)
8.8
19.2
Regional Affiliates’ passenger revenues increased $397 million, or 17.1 percent, to $2.7 billion as a result of higher yield and increased traffic. Regional
Affiliates’ traffic increased 12.3 percent to 9.9 billion revenue passenger miles (RPMs), on a capacity increase of 10.9 percent to 13.5 billion ASMs, resulting
in a 0.9 point increase in passenger load factor to 73.3 percent.
49