American Airlines 2012 Annual Report Download - page 52
Download and view the complete annual report
Please find page 52 of the 2012 American Airlines annual report below. You can navigate through the pages in the report by either clicking on the pages listed below, or by using the keyword search tool below to find specific information within the annual report.-
 1
1 -
2
-
3
-
4
-
5
-
6
-
7
-
8
-
9
-
10
-
11
-
12
-
13
-
14
-
15
-
16
-
17
-
18
-
19
-
20
-
21
-
22
-
23
-
24
-
25
-
26
-
27
-
28
-
29
-
30
-
31
-
32
-
33
-
34
-
35
-
36
-
37
-
38
-
39
-
40
-
41
-
 42
42 -
 43
43 -
 44
44 -
 45
45 -
 46
46 -
 47
47 -
 48
48 -
 49
49 -
 50
50 -
 51
51 -
 52
52 -
 53
53 -
 54
54 -
 55
55 -
 56
56 -
 57
57 -
 58
58 -
 59
59 -
 60
60 -
 61
61 -
 62
62 -
63
-
64
-
65
-
66
-
67
-
68
-
69
-
70
-
71
-
72
-
73
-
74
-
75
-
76
-
77
-
78
-
79
-
80
-
81
-
82
-
83
-
84
-
85
-
86
-
87
-
88
-
89
-
90
-
91
-
92
-
93
-
94
-
95
-
96
-
97
-
98
-
99
-
100
-
101
-
102
-
103
-
104
-
105
-
106
-
107
-
108
-
109
-
110
-
111
-
112
-
113
-
114
-
115
-
116
-
117
-
118
-
119
-
120
-
121
-
122
-
123
 |
 |

(2) Amounts include allowed claims (claims approved by the Bankruptcy Court) and estimated allowed claims relating to entry of orders treating as
unsecured claims with respect to facility agreements supporting certain issuances of special facility revenue bonds. The Debtors record an estimated
claim associated with the treatment of claims with respect to facility agreements when the applicable motion is filed with the Bankruptcy Court and
the Debtors believe that it is probable that the motion will be approved, and there is sufficient information to estimate the claim. See above, “Rejection
of Executory Contracts,” for further information.
Claims related to reorganization items are reflected in liabilities subject to compromise on the Consolidated Balance Sheet as of December 31, 2012.
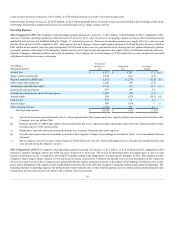
Income Tax Benefit
During 2012, the Company generated a pre-tax loss of approximately $2.5 billion and other comprehensive income of approximately $1.6 billion. In
accordance with accounting standards, the Company's net zero tax provision is required to be allocated between operating loss and accumulated other
comprehensive income. Application of this guidance required the recognition of a non-cash income tax benefit of $569 million in operating results, offset by a
$569 million charge to other comprehensive income for the year. See Note 9 to the consolidated financial statements for additional information regarding the
allocation of income tax benefit to Operating income and Accumulated other comprehensive income. The Company did not record a net tax provision (benefit)
associated with its net loss for 2011 due to the Company providing a valuation allowance, as discussed in Note 9 to the consolidated financial statements.
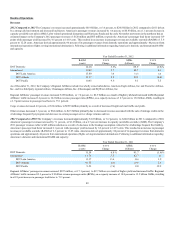
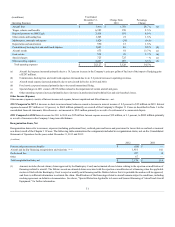
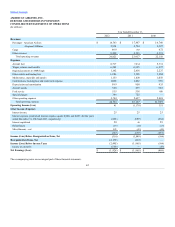
Operating Statistics
The following table provides statistical information for American and Regional Affiliates for the years ended December 31, 2012, 2011 and 2010.
Year Ended December 31,
2012
2011
2010
American Airlines, Inc. Mainline Jet Operations
Revenue passenger miles (millions)
126,406
126,491
125,486
Available seat miles (millions)
152,628
154,321
153,241
Cargo ton miles (millions)
1,761
1,783
1,886
Passenger load factor
82.8%
82.0%
81.9%
Passenger revenue yield per passenger mile (cents)
14.83
14.19
13.36
Passenger revenue per available seat mile (cents)
12.28
11.63
10.94
Cargo revenue yield per ton mile (cents)
37.97
39.40
35.65
Operating expenses per available seat mile, excluding Regional Affiliates
(cents) (*)
14.27
14.30
12.62
Fuel consumption (gallons, in millions)
2,410
2,445
2,481
Fuel price per gallon (cents)
319.8
300.9
231.0
Operating aircraft at year-end
614
608
620
Regional Affiliates
Revenue passenger miles (millions)
10,214
9,895
8,812
Available seat miles (millions)
13,595
13,507
12,179
Passenger load factor
75.1%
73.3%
72.4%
(*) Excludes $3.0 billion, $3.1 billion and $2.7 billion of expense incurred related to Regional Affiliates in 2012, 2011 and 2010, respectively.
Outlook
Capacity Guidance
AMR estimates consolidated capacity in the first quarter of 2013 to be down 1.7 percent versus the first quarter of 2012.
Factors contributing to this estimated reduction in capacity include the absence of Leap Day in 2013, and progress American has made in implementing its
Main Cabin Extra program removing seats from the coach cabin. To date, American has completed the retrofit of its Boeing 757 and 767 fleets, has completed
approximately half of its 737 fleet, and will commence the retrofit of the MD-80 fleet in January 2013 with completion targeted for the second quarter.
52