American Airlines 2012 Annual Report Download - page 93
Download and view the complete annual report
Please find page 93 of the 2012 American Airlines annual report below. You can navigate through the pages in the report by either clicking on the pages listed below, or by using the keyword search tool below to find specific information within the annual report.-
 1
1 -
2
-
3
-
4
-
5
-
6
-
7
-
8
-
9
-
10
-
11
-
12
-
13
-
14
-
15
-
16
-
17
-
18
-
19
-
20
-
21
-
22
-
23
-
24
-
25
-
26
-
27
-
28
-
29
-
30
-
31
-
32
-
33
-
34
-
35
-
36
-
37
-
38
-
39
-
40
-
41
-
42
-
43
-
44
-
45
-
46
-
47
-
48
-
49
-
50
-
51
-
52
-
53
-
54
-
55
-
56
-
57
-
58
-
59
-
60
-
61
-
62
-
63
-
64
-
65
-
66
-
67
-
68
-
69
-
70
-
71
-
72
-
73
-
74
-
75
-
76
-
77
-
78
-
79
-
80
-
81
-
82
-
 83
83 -
 84
84 -
 85
85 -
 86
86 -
 87
87 -
 88
88 -
 89
89 -
 90
90 -
 91
91 -
 92
92 -
 93
93 -
 94
94 -
 95
95 -
 96
96 -
 97
97 -
 98
98 -
 99
99 -
 100
100 -
 101
101 -
 102
102 -
 103
103 -
104
-
105
-
106
-
107
-
108
-
109
-
110
-
111
-
112
-
113
-
114
-
115
-
116
-
117
-
118
-
119
-
120
-
121
-
122
-
123
 |
 |

Table of Contents
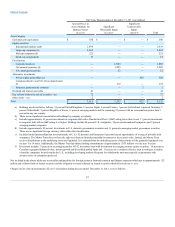
In addition, a net credit of $124 million, representing unamortized prior service credits of $157 million offset by a curtailment loss of $33 million, is included
as a component of reorganization items, net.
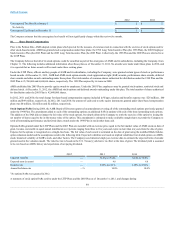
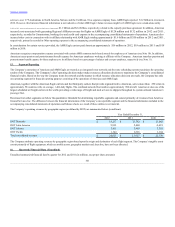
Year End Information
The following table provides a reconciliation of the changes in the pension and retiree medical and other benefit obligations and fair value of assets for the years
ended December 31, 2012 and 2011, and a statement of funded status as of December 31, 2012 and 2011 (in millions):
Pension Benefits
Retiree Medical and Other
Benefits
2012
2011
2012
2011
Reconciliation of benefit obligation
Obligation at January 1
$14,568
$12,968
$ 3,122
$ 3,097
Service cost
341
386
46
61
Interest cost
729
757
128
174
Actuarial (gain) loss
2,345
1,237
104
(63)
Plan amendments
301
—
(1,904)
(3)
Curtailments
(1,841)
—
33
—
Benefit payments
(548)
(780)
(117)
(144)
Obligation at December 31
$15,895
$14,568
$ 1,412 $ 3,122
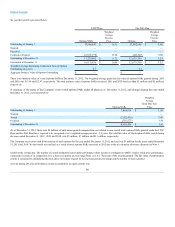
Reconciliation of fair value of plan assets
Fair value of plan assets at January 1
$ 8,132
$ 7,773
$ 205
$234
Actual return on plan assets
1,204
614
26
(6)
Employer contributions
277
525
97
121
Benefit payments
(548)
(780)
(117)
(144)
Fair value of plan assets at December 31
$9,065
$ 8,132
$211
$ 205
Funded status at December 31
$(6,830)
$ (6,436)
$(1,201)
$(2,917)
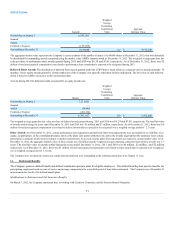
Amounts recognized in the
consolidated balance sheets
Current liability
$ 21
$ 2
$ —
$147
Noncurrent liability
6,809
6,434
1,201
2,770
$ 6,830
$6,436
$ 1,201
$2,917
Amounts recognized in
other comprehensive loss
Net actuarial loss (gain)
$3,943
$4,179
$(78)
$(181)
Prior service cost (credit)
301
68
(1,844)
(179)
$4,244
$4,247
$(1,922)
$(360)
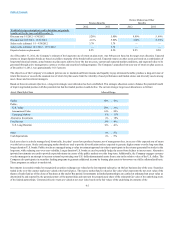
For plans with accumulated benefit
obligations exceeding the fair value
of plan assets
Pension Benefits
Retiree Medical and Other
Benefits
2012
2011
2012
2011
Projected benefit obligation (PBO)
$15,895
$14,568
$ —
$ —
Accumulated benefit obligation (ABO)
15,866
12,935
—
—
Accumulated postretirement benefit obligation (APBO)
—
—
1,412
3,122
Fair value of plan assets
9,065
8,132
211
205
ABO less fair value of plan assets
6,801
4,803
—
—
93