American Airlines 2012 Annual Report Download - page 62
Download and view the complete annual report
Please find page 62 of the 2012 American Airlines annual report below. You can navigate through the pages in the report by either clicking on the pages listed below, or by using the keyword search tool below to find specific information within the annual report.-
 1
1 -
2
-
3
-
4
-
5
-
6
-
7
-
8
-
9
-
10
-
11
-
12
-
13
-
14
-
15
-
16
-
17
-
18
-
19
-
20
-
21
-
22
-
23
-
24
-
25
-
26
-
27
-
28
-
29
-
30
-
31
-
32
-
33
-
34
-
35
-
36
-
37
-
38
-
39
-
40
-
41
-
42
-
43
-
44
-
45
-
46
-
47
-
48
-
49
-
50
-
51
-
 52
52 -
 53
53 -
 54
54 -
 55
55 -
 56
56 -
 57
57 -
 58
58 -
 59
59 -
 60
60 -
 61
61 -
 62
62 -
 63
63 -
 64
64 -
 65
65 -
 66
66 -
 67
67 -
 68
68 -
 69
69 -
 70
70 -
 71
71 -
 72
72 -
73
-
74
-
75
-
76
-
77
-
78
-
79
-
80
-
81
-
82
-
83
-
84
-
85
-
86
-
87
-
88
-
89
-
90
-
91
-
92
-
93
-
94
-
95
-
96
-
97
-
98
-
99
-
100
-
101
-
102
-
103
-
104
-
105
-
106
-
107
-
108
-
109
-
110
-
111
-
112
-
113
-
114
-
115
-
116
-
117
-
118
-
119
-
120
-
121
-
122
-
123
 |
 |
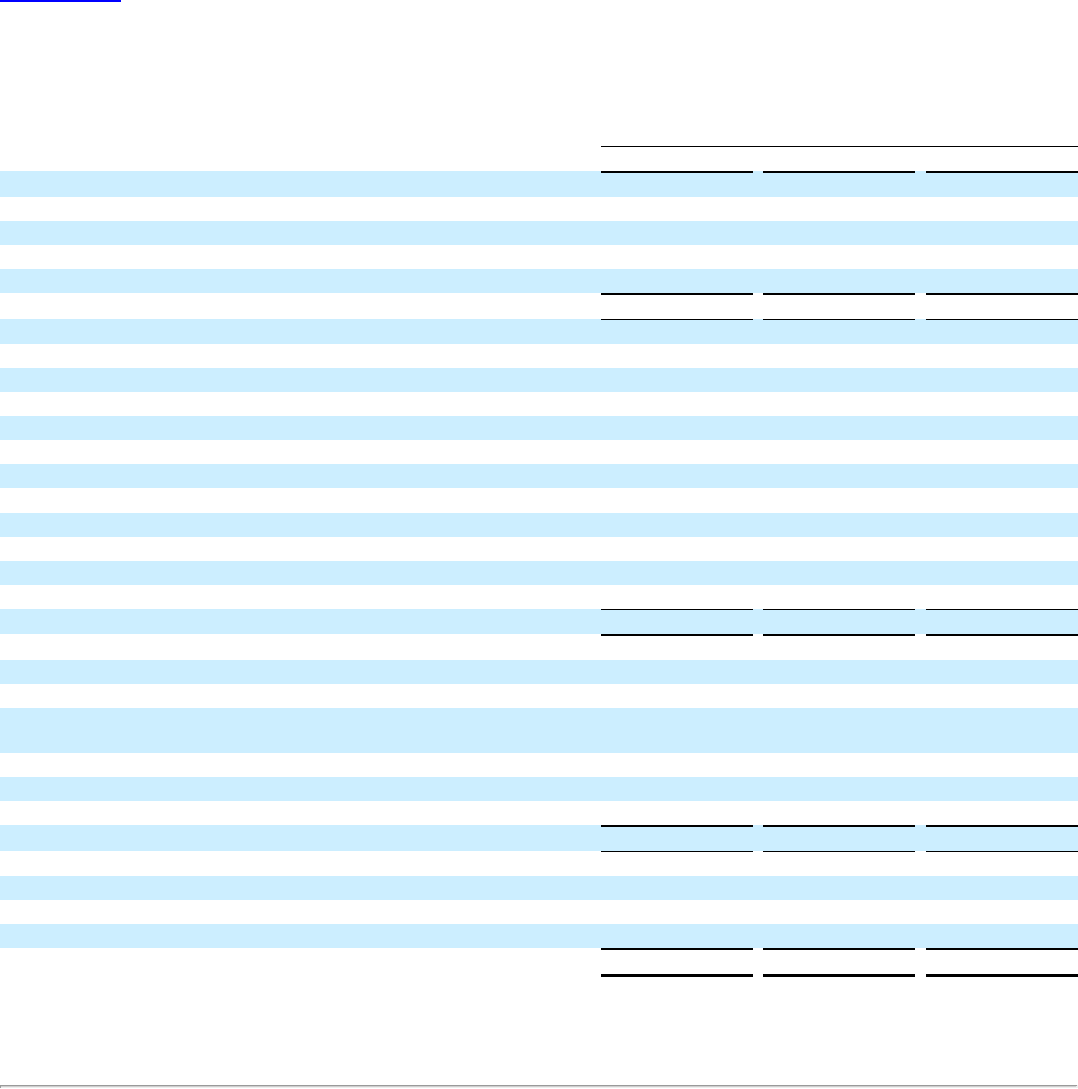
Table of Contents
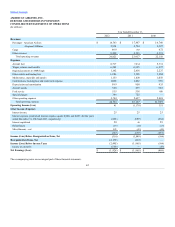
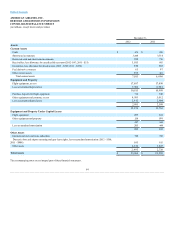
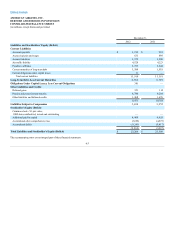
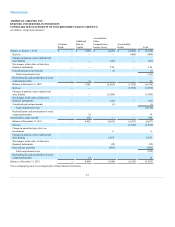
AMERICAN AIRLINES, INC.
DEBTORS AND DEBTORS IN POSSESSION
CONSOLIDATED STATEMENTS OF OPERATIONS
(In millions)
Year Ended December 31,
2012
2011
2010
Revenues
Passenger - American Airlines
$18,743
$17,947
$16,760
- Regional Affiliates
2,914
2,724
2,327
Cargo
669
703
672
Other revenues
2,499
2,583
2,391
Total operating revenues
24,825
23,957
22,150
Expenses
Aircraft fuel
8,717
7,434
5,731
Wages, salaries and benefits
6,242
6,385
6,227
Regional payments to AMR Eagle
1,142
2,418
2,227
Other rentals and landing fees
1,286
1,305
1,284
Maintenance, materials and repairs
1,133
1,020
1,056
Commissions, booking fees and credit card expense
1,050
1,062
976
Depreciation and amortization
999
950
935
Aircraft rentals
550
673
592
Food service
535
518
490
Special charges
386
725
—
Other operating expenses
2,744
2,637
2,481
Total operating expenses
24,784
25,127
21,999
Operating Income (Loss)
41
(1,170)
151
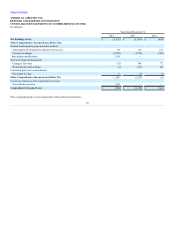
Other Income (Expense)
Interest income
25
25
25
Interest expense (contractual interest expense equals $(686) and $(691) for the years
ended December 31, 2012 and 2011, respectively)
(662)
(689)
(654)
Interest capitalized
50
40
29
Related party
(13)
(14)
(13)
Miscellaneous – net
243
(41)
(42)
(357)
(679)
(655)
Income (Loss) Before Reorganization Items, Net
(316)
(1,849)
(504)
Reorganization Items, Net
(2,179)
(116)
—
Income (Loss) Before Income Taxes
(2,495)
(1,965)
(504)
Income tax (benefit)
(569)
—
(35)
Net Earnings (Loss)
$(1,926)
$(1,965)
$ (469)
The accompanying notes are an integral part of these financial statements.
62