American Airlines 2012 Annual Report Download - page 97
Download and view the complete annual report
Please find page 97 of the 2012 American Airlines annual report below. You can navigate through the pages in the report by either clicking on the pages listed below, or by using the keyword search tool below to find specific information within the annual report.-
 1
1 -
2
-
3
-
4
-
5
-
6
-
7
-
8
-
9
-
10
-
11
-
12
-
13
-
14
-
15
-
16
-
17
-
18
-
19
-
20
-
21
-
22
-
23
-
24
-
25
-
26
-
27
-
28
-
29
-
30
-
31
-
32
-
33
-
34
-
35
-
36
-
37
-
38
-
39
-
40
-
41
-
42
-
43
-
44
-
45
-
46
-
47
-
48
-
49
-
50
-
51
-
52
-
53
-
54
-
55
-
56
-
57
-
58
-
59
-
60
-
61
-
62
-
63
-
64
-
65
-
66
-
67
-
68
-
69
-
70
-
71
-
72
-
73
-
74
-
75
-
76
-
77
-
78
-
79
-
80
-
81
-
82
-
83
-
84
-
85
-
86
-
 87
87 -
 88
88 -
 89
89 -
 90
90 -
 91
91 -
 92
92 -
 93
93 -
 94
94 -
 95
95 -
 96
96 -
 97
97 -
 98
98 -
 99
99 -
 100
100 -
 101
101 -
 102
102 -
 103
103 -
 104
104 -
 105
105 -
 106
106 -
 107
107 -
108
-
109
-
110
-
111
-
112
-
113
-
114
-
115
-
116
-
117
-
118
-
119
-
120
-
121
-
122
-
123
 |
 |

Table of Contents
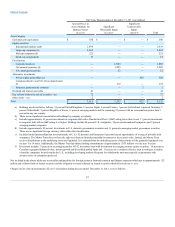
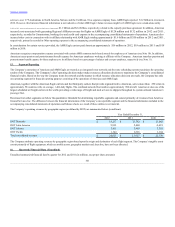
Fair Value Measurements at December 31, 2011 (in millions)
Quoted Prices in
Active Markets for
Identical Assets
(Level 1)
Significant
Observable Inputs
(Level 2)
Significant
Unobservable
Inputs
(Level 3)
Total
Asset Category
Cash and cash equivalents
$ 160
$ —
$ —
$ 160
Equity securities
International markets (a)(b)
1,939
—
—
1,939
Large-cap companies (b)
1,462
—
—
1,462
Mid-cap companies (b)
221
—
—
221
Small-cap companies(b)
17
—
—
17
Fixed Income
Corporate bonds (c)
—
1,866
—
1,866
Government securities (d)
—
1,205
—
1,205
U.S. municipal securities
—
52
—
52
Alternative investments
Private equity partnerships (e)
—
—
920
920
Common/collective and 103-12 investment trusts
(f)
—
172
—
172
Insurance group annuity contracts
—
—
2
2
Dividend and interest receivable
42
—
—
42
Due to/from brokers for sale of securities - net
72
—
—
72
Other assets – net
2
—
—
2
Total
$3,915
$3,295
$922
$ 8,132
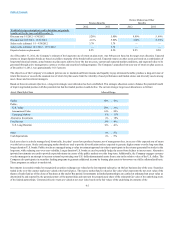
a) Holdings are diversified as follows: 22 percent United Kingdom, 10 percent Japan, 9 percent France, 7 percent Switzerland, 6 percent Germany, 5
percent Netherlands, 5 percent Republic of Korea, 13 percent emerging markets and the remaining 23 percent with no concentration greater than 5
percent in any one country.
b) There are no significant concentration of holdings by company or industry.
c) Includes approximately 83 percent investments in corporate debt with a Standard and Poor’s (S&P) rating lower than A and 17 percent investments
in corporate debt with an S&P rating A or higher. Holdings include 80 percent U.S. companies, 18 percent international companies and 2 percent
emerging market companies.
d) Includes approximately 89 percent investments in U.S. domestic government securities and 11 percent in emerging market government securities.
There are no significant foreign currency risks within this classification.
e) Includes limited partnerships that invest primarily in U.S. ( 92 percent) and European (8 percent) buyout opportunities of a range of privately held
companies. The Master Trust does not have the right to redeem its limited partnership investment at its net asset value. Instead, the Master Trust
receives distributions as the underlying assets are liquidated. It is estimated that the underlying assets of these funds will be gradually liquidated over
the next 1 to 10 years. Additionally, the Master Trust has future funding commitments of approximately $335 million over the next 10 years.
f) Investment includes 71 percent in an emerging market 103-12 investment trust with investments in emerging country equity securities, 16 percent in
Canadian segregated balanced value, income growth and diversified pooled funds and 13 percent in a common/collective trust investing in securities
of smaller companies located outside the U.S., including developing markets. Requests for withdrawals must meet specific requirements with
advance notice of redemption preferred.
Not included in the above tables are receivables and payables for foreign currency forward contracts and futures contracts which net to approximately $2
million and collateral held on loaned securities and the obligation to return collateral on loaned securities which effectively net to zero.
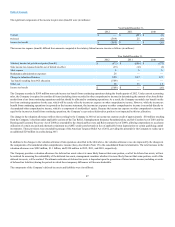
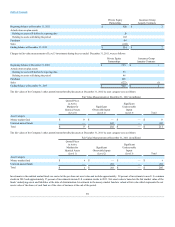
Changes in fair value measurements of Level 3 investments during the year ended December 31, 2012, were as follows:
97