American Airlines 2012 Annual Report Download - page 43
Download and view the complete annual report
Please find page 43 of the 2012 American Airlines annual report below. You can navigate through the pages in the report by either clicking on the pages listed below, or by using the keyword search tool below to find specific information within the annual report.-
 1
1 -
2
-
3
-
4
-
5
-
6
-
7
-
8
-
9
-
10
-
11
-
12
-
13
-
14
-
15
-
16
-
17
-
18
-
19
-
20
-
21
-
22
-
23
-
24
-
25
-
26
-
27
-
28
-
29
-
30
-
31
-
32
-
 33
33 -
 34
34 -
 35
35 -
 36
36 -
 37
37 -
 38
38 -
 39
39 -
 40
40 -
 41
41 -
 42
42 -
 43
43 -
 44
44 -
 45
45 -
 46
46 -
 47
47 -
 48
48 -
 49
49 -
 50
50 -
 51
51 -
 52
52 -
 53
53 -
54
-
55
-
56
-
57
-
58
-
59
-
60
-
61
-
62
-
63
-
64
-
65
-
66
-
67
-
68
-
69
-
70
-
71
-
72
-
73
-
74
-
75
-
76
-
77
-
78
-
79
-
80
-
81
-
82
-
83
-
84
-
85
-
86
-
87
-
88
-
89
-
90
-
91
-
92
-
93
-
94
-
95
-
96
-
97
-
98
-
99
-
100
-
101
-
102
-
103
-
104
-
105
-
106
-
107
-
108
-
109
-
110
-
111
-
112
-
113
-
114
-
115
-
116
-
117
-
118
-
119
-
120
-
121
-
122
-
123
 |
 |

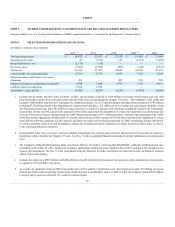
Financial Highlights
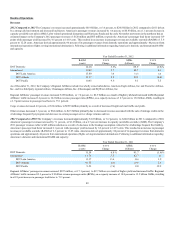
The Company recorded a consolidated net loss of $1.9 billion in 2012 compared to a net loss of $2.0 billion in 2011. The Company’s consolidated net loss
reflects $2.2 billion of charges to reorganization items, net and significant year-over-year increases in fuel prices, offset by higher operating revenues.
Consolidated passenger revenue increased by $1.0 billion to $21.7 billion in 2012 compared to the prior year driven by a strong yield environment and
increased load factors. Cargo and other revenues decreased by $118 million to $3.2 billion for 2012 compared to the prior year. Mainline passenger unit
revenues increased 5.6 percent in 2012 due to a 4.5 percent increase in passenger yield year-over-year. This also reflects an increase in load factor of
approximately 0.9 points compared to 2011.
Charges to reorganization items, net, of $2.2 billion for 2012 are primarily from estimated claims associated with restructuring the financing arrangements for
certain debt and aircraft, including an estimated net loss of $276 million related to the modification of the financing arrangement for the Embraer RJ-140 and
RJ-145 aircraft, other claim settlements and professional fees. Fuel prices continued the trend set in 2011, with prices remaining high and extremely volatile.
The Company paid an average of $3.20 per gallon in 2012 compared to an average of $3.01 per gallon in 2011, including the effects of hedging. As a result,
fuel expense, taking into account the impact of fuel hedging, increased $1.3 billion year-over-year to $8.7 billion. Hedging gains reduced fuel expense by
approximately $4 million. Other operating expenses were lower reflecting the initial impact of the Chapter 11 restructuring process.
In addition, the Company’s 2012 results were impacted by the following items:
•The Company recognized a $569 million non-cash income tax benefit during the fourth quarter of 2012 related to gains in other comprehensive
income. See Note 9 to the consolidated financial statements for further information.
•In 2012, the Company recorded $360 million of charges for severance related costs associated with planned reductions in certain work groups.
•In late September and early October 2012, the Company experienced a labor related operational disruption resulting in the cancellation or delay of a
substantial number of flights and which affected bookings for fourth quarter travel. This negatively impacted 2012 revenue and net earnings by
approximately $120 million and $112 million, respectively.
•Hurricane Sandy and the early November snow storm in the Northeast negatively impacted fourth quarter 2012 revenues and net earnings by
approximately $65 million and $49 million, respectively.
•The Company's fourth quarter results include a $280 million benefit from a settlement of a commercial dispute.
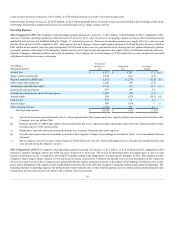
The Company recorded a consolidated net loss of $2.0 billion in 2011 compared to a net loss of $469 million in 2010. The Company’s consolidated net loss
reflected significant year-over-year increases in fuel prices, partially offset by higher operating revenues. Consolidated passenger revenue increased by $1.6
billion to $20.7 billion in 2011 compared to the prior year. Cargo and other revenues increased by $223 million to $3.3 billion for 2011 compared to the prior
year. Mainline passenger unit revenues increased 6.3 percent in 2011 due to a 6.2 percent increase in passenger yield year-over-year. This also reflected an
increase in load factor of approximately 0.1 percent compared to 2010.
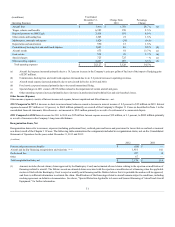
The increase in total operating revenue was offset by significantly higher year-over-year fuel prices. Fuel prices increased significantly through the second
quarter and remained high and extremely volatile through year-end 2011. The Company paid an average of $3.01 per gallon in 2011 compared to an average of
$2.31 per gallon in 2010, including the effects of hedging. As a result, fuel expense, taking into account the impact of fuel hedging, increased $1.7 billion
year-over-year to $7.4 billion. Hedging gains reduced fuel expense by approximately $297 million.
In addition, the Company’s 2011 results were negatively impacted by the following items:
•In the first quarter of 2011, the Company incurred approximately $31 million in non-recurring non-cash charges related to certain sale/leaseback
transactions.
•Also in the first quarter of 2011, several events transpired which adversely impacted system operations, including extreme weather events in January
and February, a catastrophic earthquake and tsunami in Japan, and a fire at Miami International Airport that adversely affected American’s aircraft
fueling capabilities at the airport. These events, combined with the effect of the Company’s efforts to improve distribution of the Company’s
products (as described under the GDS discussion above), resulted in reduced revenue in the first quarter.
•The Company’s second quarter revenue results reflected approximately $60 million in lower revenue due to the extreme weather events during the
quarter in Dallas-Fort Worth and the continued impact of the earthquake that struck Japan in March 2011.
•In the fourth quarter of 2011, the Debtors recognized $116 million in reorganization items related to expenses (including professional fees) and
provisions for losses that are realized or incurred in the Chapter 11 Cases.
•Also in the fourth quarter of 2011, special charges and other items consisted of $768 million, including $725 million
43