American Airlines 2012 Annual Report Download - page 56
Download and view the complete annual report
Please find page 56 of the 2012 American Airlines annual report below. You can navigate through the pages in the report by either clicking on the pages listed below, or by using the keyword search tool below to find specific information within the annual report.-
 1
1 -
2
-
3
-
4
-
5
-
6
-
7
-
8
-
9
-
10
-
11
-
12
-
13
-
14
-
15
-
16
-
17
-
18
-
19
-
20
-
21
-
22
-
23
-
24
-
25
-
26
-
27
-
28
-
29
-
30
-
31
-
32
-
33
-
34
-
35
-
36
-
37
-
38
-
39
-
40
-
41
-
42
-
43
-
44
-
45
-
 46
46 -
 47
47 -
 48
48 -
 49
49 -
 50
50 -
 51
51 -
 52
52 -
 53
53 -
 54
54 -
 55
55 -
 56
56 -
 57
57 -
 58
58 -
 59
59 -
 60
60 -
 61
61 -
 62
62 -
 63
63 -
 64
64 -
 65
65 -
 66
66 -
67
-
68
-
69
-
70
-
71
-
72
-
73
-
74
-
75
-
76
-
77
-
78
-
79
-
80
-
81
-
82
-
83
-
84
-
85
-
86
-
87
-
88
-
89
-
90
-
91
-
92
-
93
-
94
-
95
-
96
-
97
-
98
-
99
-
100
-
101
-
102
-
103
-
104
-
105
-
106
-
107
-
108
-
109
-
110
-
111
-
112
-
113
-
114
-
115
-
116
-
117
-
118
-
119
-
120
-
121
-
122
-
123
 |
 |

Table of Contents
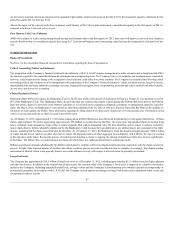
2012
2011
Discount rate (cost/liability)
5.20% /4.20%
5.80% /5.20%
Expected return on plan assets
8.25%
8.50%
Expected health care cost trend rate:
Pre-65 individuals
Initial
7.0%
7.5%
Ultimate
4.5%
4.5%
Post-65 individuals
Initial
7.0%
7.5%
Ultimate (2010)
4.5%
4.5%
Pilot Retirement Age
63
63
When establishing our discount rate to measure our obligations, we match high quality corporate bonds available in the marketplace whose cash flows
approximate our projected benefit disbursements. Lowering the discount rate by 50 basis points as of December 31, 2012 would increase the Company’s
pension and postretirement benefits obligations by approximately $1.2 billion and $60 million, respectively, and increase estimated 2013 pension and
postretirement benefit expense by $1 million and $4 million, respectively.
The expected return on plan assets is based upon an evaluation of the Company’s historical trends and experience taking into account current and expected
market conditions and the Company’s target asset allocation of 35 percent longer duration corporate and U.S. government/agency bonds, 27 percent U.S.
value stocks, 19 percent developed international stocks, 8 percent emerging markets stocks and bonds and 11 percent alternative (private) investments. The
expected return on plan assets component of the Company’s net periodic benefit cost is calculated based on the fair value of plan assets and the Company’s
target asset allocation. The Company monitors its actual asset allocation and believes that its long-term asset allocation will continue to approximate its target
allocation. The Company’s historical annualized ten-year rate of return on plan assets, calculated using a geometric compounding of monthly returns, is
approximately 10.4 percent as of December 31, 2012. Lowering the expected long-term rate of return on plan assets by 50 basis points as of December 31,
2012 would increase estimated 2013 pension expense by approximately $44 million.
The health care cost trend rate is based upon an evaluation of the Company’s historical trends and experience taking into account current and expected market
conditions. Increasing the assumed health care cost trend rate by 100 basis points would increase estimated 2013 postretirement benefits expense by $15
million.
See Note 11 to the consolidated financial statements for additional information regarding the Company’s retirement benefits.
Income taxes – The Company generally believes that the positions taken on previously filed income tax returns are more likely than not to be sustained by the
taxing authorities. The Company has recorded income tax and related interest liabilities where the Company believes its position may not be sustained or where
the full income tax benefit will not be recognized. The effects of potential income tax benefits resulting from the Company’s unrecognized tax positions are not
reflected in the tax balances of the financial statements. Recognized and unrecognized tax positions are reviewed and adjusted as events occur that affect the
Company’s judgment about the recognizability of income tax benefits, such as lapsing of applicable statutes of limitations, conclusion of tax audits, release of
administrative guidance, or rendering of a court decision affecting a particular tax position. The Company records a deferred tax asset valuation allowance
when it is more likely than not that some portion or all of its deferred tax assets will not be realized. The Company considers its historical earnings, trends,
and outlook for future years in making this determination. The Company had a deferred tax valuation allowance of $5.1 billion and $4.8 billion, respectively,
at December 31, 2012 and 2011. See Note 9 to the consolidated financial statements for additional information.
Derivatives – As required by U.S. GAAP, the Company assesses, both at the inception of each hedge and on an ongoing basis, whether the derivatives that
are used in its hedging transactions are highly effective in offsetting changes in cash flows of the hedged items. In doing so, the Company uses a regression
model to determine the correlation of the change in prices of the commodities used to hedge jet fuel (e.g., NYMEX Heating oil) to the change in the price of jet
fuel. The Company also monitors the actual dollar offset of the hedges’ market values as compared to hypothetical jet fuel hedges. The fuel hedge contracts are
generally deemed to be “highly effective” if the R-squared is greater than 80 percent and the dollar offset correlation is within 80 percent to 125 percent. The
Company discontinues hedge accounting prospectively if it determines that a derivative is no longer expected to be highly effective as a hedge or if it decides to
discontinue the hedging relationship. The fair value of the Company’s hedging contracts is recorded in Current Assets or Current Liabilities in the
accompanying consolidated balance sheets and is recorded gross of the collateral posted and on a trade basis. As of December 31, 2012, the Company had
derivative contracts in an asset position at fair value of $65 million. A deferred gain of $15 million was recorded in Accumulated other comprehensive
56