American Airlines 2012 Annual Report Download - page 98
Download and view the complete annual report
Please find page 98 of the 2012 American Airlines annual report below. You can navigate through the pages in the report by either clicking on the pages listed below, or by using the keyword search tool below to find specific information within the annual report.-
 1
1 -
2
-
3
-
4
-
5
-
6
-
7
-
8
-
9
-
10
-
11
-
12
-
13
-
14
-
15
-
16
-
17
-
18
-
19
-
20
-
21
-
22
-
23
-
24
-
25
-
26
-
27
-
28
-
29
-
30
-
31
-
32
-
33
-
34
-
35
-
36
-
37
-
38
-
39
-
40
-
41
-
42
-
43
-
44
-
45
-
46
-
47
-
48
-
49
-
50
-
51
-
52
-
53
-
54
-
55
-
56
-
57
-
58
-
59
-
60
-
61
-
62
-
63
-
64
-
65
-
66
-
67
-
68
-
69
-
70
-
71
-
72
-
73
-
74
-
75
-
76
-
77
-
78
-
79
-
80
-
81
-
82
-
83
-
84
-
85
-
86
-
87
-
 88
88 -
 89
89 -
 90
90 -
 91
91 -
 92
92 -
 93
93 -
 94
94 -
 95
95 -
 96
96 -
 97
97 -
 98
98 -
 99
99 -
 100
100 -
 101
101 -
 102
102 -
 103
103 -
 104
104 -
 105
105 -
 106
106 -
 107
107 -
 108
108 -
109
-
110
-
111
-
112
-
113
-
114
-
115
-
116
-
117
-
118
-
119
-
120
-
121
-
122
-
123
 |
 |

Table of Contents
Private Equity
Partnerships
Insurance Group
Annuity Contracts
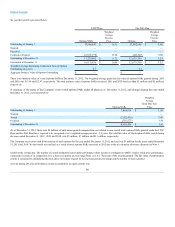
Beginning balance at December 31, 2011
$ 920
$ 2
Actual return on plan assets:
Relating to assets still held at the reporting date
20
Relating to assets sold during the period
102
Purchases
96
Sales
(224)
Ending balance at December 31, 2012
$ 914
$ 2
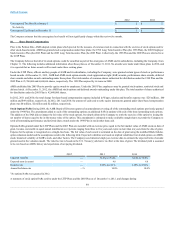
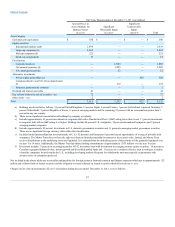
Changes in fair value measurements of Level 3 investments during the year ended December 31, 2011, were as follows:
Private Equity
Partnerships
Insurance Group
Annuity Contracts
Beginning balance at December 31, 2010
$795
$3
Actual return on plan assets:
Relating to assets still held at the reporting date
53
Relating to assets sold during the period
48
Purchases
146
Sales
(122)
(1)
Ending balance at December 31, 2011
$ 920
$ 2
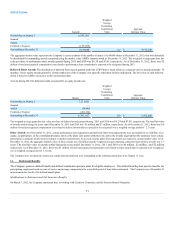
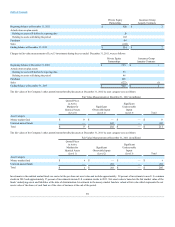
The fair values of the Company’s other postretirement benefit plan assets at December 31, 2012 by asset category were as follows:
Fair Value Measurements at December 31, 2012 (in millions)
Quoted Prices
in Active
Markets for
Identical Assets
(Level 1)
Significant
Observable Inputs
(Level 2)
Significant
Unobservable
Inputs
(Level 3)
Total
Asset Category
Money market fund
$ 9
$ —
$ —
$ 9
Unitized mutual funds
—
202
—
202
Total
$ 9
$202
$ —
$211
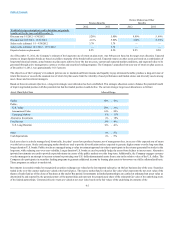
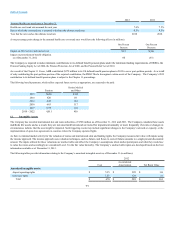
The fair values of the Company’s other postretirement benefit plan assets at December 31, 2011 by asset category were as follows:
Fair Value Measurements at December 31, 2011 (in millions)
Quoted Prices
in Active
Markets for
Identical Assets
(Level 1)
Significant
Observable Inputs
(Level 2)
Significant
Unobservable
Inputs
(Level 3)
Total
Asset Category
Money market fund
$4
$ —
$ —
$4
Unitized mutual funds
—
201
—
201
Total
$4
$201
$ —
$ 205
Investments in the unitized mutual funds are carried at the per share net asset value and include approximately 28 percent of investments in non-U.S. common
stocks in 2012 and approximately 27 percent of investments in non-U.S. common stocks in 2011. Net asset value is based on the fair market value of the
funds’ underlying assets and liabilities at the date of determination. Investments in the money market fund are valued at fair value which represents the net
assets value of the shares of such fund as of the close of business at the end of the period.
98