American Airlines 2012 Annual Report Download - page 94
Download and view the complete annual report
Please find page 94 of the 2012 American Airlines annual report below. You can navigate through the pages in the report by either clicking on the pages listed below, or by using the keyword search tool below to find specific information within the annual report.-
 1
1 -
2
-
3
-
4
-
5
-
6
-
7
-
8
-
9
-
10
-
11
-
12
-
13
-
14
-
15
-
16
-
17
-
18
-
19
-
20
-
21
-
22
-
23
-
24
-
25
-
26
-
27
-
28
-
29
-
30
-
31
-
32
-
33
-
34
-
35
-
36
-
37
-
38
-
39
-
40
-
41
-
42
-
43
-
44
-
45
-
46
-
47
-
48
-
49
-
50
-
51
-
52
-
53
-
54
-
55
-
56
-
57
-
58
-
59
-
60
-
61
-
62
-
63
-
64
-
65
-
66
-
67
-
68
-
69
-
70
-
71
-
72
-
73
-
74
-
75
-
76
-
77
-
78
-
79
-
80
-
81
-
82
-
83
-
 84
84 -
 85
85 -
 86
86 -
 87
87 -
 88
88 -
 89
89 -
 90
90 -
 91
91 -
 92
92 -
 93
93 -
 94
94 -
 95
95 -
 96
96 -
 97
97 -
 98
98 -
 99
99 -
 100
100 -
 101
101 -
 102
102 -
 103
103 -
 104
104 -
105
-
106
-
107
-
108
-
109
-
110
-
111
-
112
-
113
-
114
-
115
-
116
-
117
-
118
-
119
-
120
-
121
-
122
-
123
 |
 |

Table of Contents
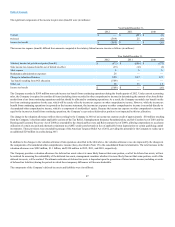
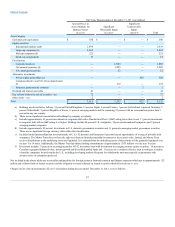
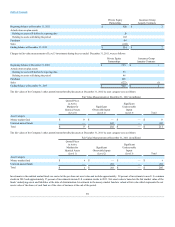
At December 31, 2012 and 2011, pension benefit plan assets of $259 million and $143 million, respectively, and retiree medical and other benefit plan assets
of $208 million and $203 million, respectively, were invested in shares of certain mutual funds.
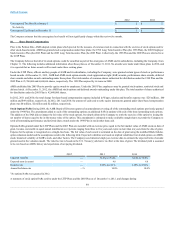
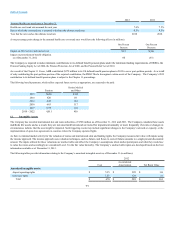
The following tables provide the components of net periodic benefit cost for the years ended December 31, 2012, 2011 and 2010 (in millions):
Pension Benefits
2012
2011
2010
Components of net periodic benefit cost
Defined benefit plans:
Service cost
$341
$ 386
$366
Interest cost
729
757
737
Expected return on assets
(676)
(657)
(593)
Curtailments
58
—
—
Amortization of:
Prior service cost
10
13
13
Unrecognized net loss
211
154
154
Net periodic benefit cost for defined benefit plans
673
653
677
Defined contribution plans
202
162
152
$875
$815
$829
The estimated net loss for the defined benefit pension plans that will be amortized from accumulated other comprehensive income into net periodic benefit cost
over the next fiscal year is $77 million.
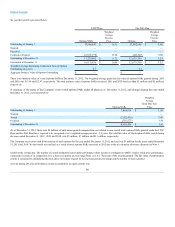
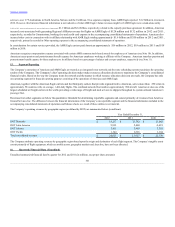
Retiree Medical and Other Benefits
2012
2011
2010
Components of net periodic benefit cost
Service cost
$ 46
$61
$ 60
Interest cost
128
174
165
Expected return on assets
(17)
(20)
(18)
Curtailments
(124)
—
—
Amortization of:
Prior service cost
(82)
(28)
(19)
Unrecognized net loss (gain)
(9)
(9)
(10)
Net periodic benefit cost
$ (58)
$ 178
$ 178
The estimated net gain for the retiree medical and other postretirement plans that will be amortized from accumulated other comprehensive income into net
periodic benefit cost over the next fiscal year is $9 million.
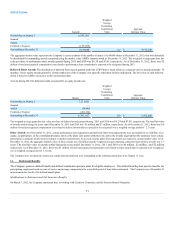
Pension Benefits
Retiree Medical and Other
Benefits
2012
2011
2012
2011
Weighted-average assumptions used to determine benefit
obligations as of December 31
Discount rate
4.20%
5.20%
3.80%
4.89%
Salary scale (ultimate)
—
3.78
—
—
94