American Airlines 2012 Annual Report Download - page 50
Download and view the complete annual report
Please find page 50 of the 2012 American Airlines annual report below. You can navigate through the pages in the report by either clicking on the pages listed below, or by using the keyword search tool below to find specific information within the annual report.-
 1
1 -
2
-
3
-
4
-
5
-
6
-
7
-
8
-
9
-
10
-
11
-
12
-
13
-
14
-
15
-
16
-
17
-
18
-
19
-
20
-
21
-
22
-
23
-
24
-
25
-
26
-
27
-
28
-
29
-
30
-
31
-
32
-
33
-
34
-
35
-
36
-
37
-
38
-
39
-
 40
40 -
 41
41 -
 42
42 -
 43
43 -
 44
44 -
 45
45 -
 46
46 -
 47
47 -
 48
48 -
 49
49 -
 50
50 -
 51
51 -
 52
52 -
 53
53 -
 54
54 -
 55
55 -
 56
56 -
 57
57 -
 58
58 -
 59
59 -
 60
60 -
61
-
62
-
63
-
64
-
65
-
66
-
67
-
68
-
69
-
70
-
71
-
72
-
73
-
74
-
75
-
76
-
77
-
78
-
79
-
80
-
81
-
82
-
83
-
84
-
85
-
86
-
87
-
88
-
89
-
90
-
91
-
92
-
93
-
94
-
95
-
96
-
97
-
98
-
99
-
100
-
101
-
102
-
103
-
104
-
105
-
106
-
107
-
108
-
109
-
110
-
111
-
112
-
113
-
114
-
115
-
116
-
117
-
118
-
119
-
120
-
121
-
122
-
123
 |
 |

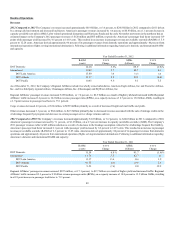
Cargo revenues increased 4.5 percent, or $31 million, to $703 million primarily as a result of increased freight yields.
Other revenues increased 8.0 percent, or $192 million, to $2.6 billion primarily due to increased revenue associated with the sale of mileage credits in the
AAdvantage frequent flyer program and increases in certain passenger service charge volumes and fees.
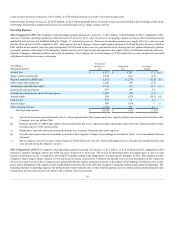
Operating Expenses
2012 Compared to 2011 The Company’s total operating expenses decreased 1.4 percent, or $0.3 billion, to $24.8 billion in 2012 compared to 2011.
American’s mainline operating expenses per ASM decreased 0.2 percent to 14.27 cents. The decrease in operating expense was largely due to decreased aircraft
and facility rent as leases are modified during the Chapter 11 restructuring process. Decreases in operating expenses were largely offset by a year-over-year
increase in fuel prices in 2012 compared to 2011. Fuel expense was the Company’s largest single expense category in 2012 and the price increase resulted in
$454 million in incremental year-over-year fuel expense in 2012 (based on the year-over-year increase in the average price per gallon multiplied by gallons
consumed, inclusive of the impact of fuel hedging). Further increases in fuel prices and/or disruptions in the supply of fuel would further materially adversely
affect the Company’s financial condition and results of operations. The Company also incurred charges of $360 million for severance related costs associated
with planned reductions in certain work groups.
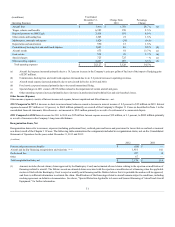
(in millions)
Operating Expenses
Year Ended
December 31,
2012
Change from
2011
Percentage
Change
Aircraft fuel $8,717
$ 1,283
17.3 % (a)
Wages, salaries and benefits 6,242
(143)
(2.2)
Regional payments to AMR Eagle 1,142
(1,276)
(52.8) (b)
Other rentals and landing fees 1,286
(19)
(1.5)
Maintenance, materials and repairs 1,133
113
11.1 (c)
Depreciation and amortization 999
49
5.2
Commissions, booking fees and credit card expense 1,050
(12)
(1.1)
Aircraft rentals 550
(123)
(18.2)(d)
Food service 535
17
3.2
Special charges 386
(339)
—(e)
Other operating expenses 2,744
107
4.1
Total operating expenses $24,784
$(343)
(1.4)%
(a) Aircraft fuel expense increased primarily due to certain regional airline fuel expense under new capacity purchase agreements and an increase in the
Company's price per gallon of fuel.
(b) Regional payments to AMR Eagle expense decreased primarily due to new capacity purchase agreements under which the Company absorbs certain
operating expenses of the regional airline.
(c) Maintenance, materials and repairs increased primarily due to timing of materials and repairs expenses.
(d) Aircraft rental expense decreased primarily as a result of the Company’s Chapter 11 proceedings as described in Note 1 to the consolidated financial
statements.
(e) Special charges consist of severance related charges of $360 million and write off of lease hold improvements on aircraft and at airport facilities that
were rejected during the Chapter 11 process.
2011 Compared to 2010 The Company’s total operating expenses increased 14.2 percent, or $3.1 billion, to $25.1 billion in 2011 compared to 2010.
American’s mainline operating expenses per ASM increased 13.4 percent to 14.30 cents. The increase in operating expense was largely due to a year-over-year
increase in fuel prices in 2011 compared to 2010 and $725 million related to the impairment of certain aircraft and gates in 2011. Fuel expense was the
Company’s largest single expense category in 2011 and the price increase resulted in $1.7 billion in incremental year-over-year fuel expense in 2011 (based on
the year-over-year increase in the average price per gallon multiplied by gallons consumed, inclusive of the impact of fuel hedging). Further increases in fuel
prices and/or disruptions in the supply of fuel would further materially adversely affect the Company’s financial condition and results of operations. The
remaining increase in operating expense was primarily due to labor related costs, revenue related expenses, such as credit card fees and booking fees and
commissions, and increased aircraft rent related to the Company’s fleet renewal plan.
50