American Express 2012 Annual Report Download - page 44
Download and view the complete annual report
Please find page 44 of the 2012 American Express annual report below. You can navigate through the pages in the report by either clicking on the pages listed below, or by using the keyword search tool below to find specific information within the annual report.-
 1
1 -
2
-
3
-
4
-
5
-
6
-
7
-
8
-
9
-
10
-
11
-
12
-
13
-
14
-
15
-
16
-
17
-
18
-
19
-
20
-
21
-
22
-
23
-
24
-
25
-
26
-
27
-
28
-
29
-
30
-
31
-
32
-
33
-
 34
34 -
 35
35 -
 36
36 -
 37
37 -
 38
38 -
 39
39 -
 40
40 -
 41
41 -
 42
42 -
 43
43 -
 44
44 -
 45
45 -
 46
46 -
 47
47 -
 48
48 -
 49
49 -
 50
50 -
 51
51 -
 52
52 -
 53
53 -
 54
54 -
55
-
56
-
57
-
58
-
59
-
60
-
61
-
62
-
63
-
64
-
65
-
66
-
67
-
68
-
69
-
70
-
71
-
72
-
73
-
74
-
75
-
76
-
77
-
78
-
79
-
80
-
81
-
82
-
83
-
84
-
85
-
86
-
87
-
88
-
89
-
90
-
91
-
92
-
93
-
94
-
95
-
96
-
97
-
98
-
99
-
100
-
101
-
102
-
103
-
104
-
105
-
106
-
107
-
108
-
109
-
110
-
111
-
112
-
113
-
114
-
115
-
116
-
117
-
118
-
119
-
120
 |
 |

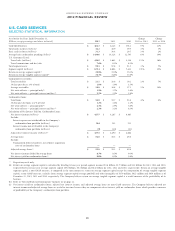
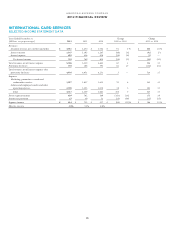
AMERICAN EXPRESS COMPANY
2012 FINANCIAL REVIEW
U.S. CARD SERVICES
SELECTED INCOME STATEMENT DATA
Years Ended December 31,
(Millions, except percentages) 2012 2011 2010
Change
2012 vs. 2011
Change
2011 vs. 2010
Revenues
Discount revenue, net card fees and other $ 11,469 $ 10,804 $ 9,997 $ 665 6 % $ 807 8 %
Interest income 5,342 5,074 5,277 268 5 (203) (4)
Interest expense 765 807 812 (42) (5) (5) (1)
Net interest income 4,577 4,267 4,465 310 7 (198) (4)
Total revenues net of interest expense 16,046 15,071 14,462 975 6 609 4
Provisions for losses 1,429 687 1,591 742 # (904) (57)
Total revenues net of interest expense after
provisions for losses 14,617 14,384 12,871 233 2 1,513 12
Expenses
Marketing, promotion, rewards and
cardmember services 6,552 6,593 5,744 (41) (1) 849 15
Salaries and employee benefits and other
operating expenses 3,996 3,662 3,623 334 9 39 1
Total 10,548 10,255 9,367 293 3 888 9
Pretax segment income 4,069 4,129 3,504 (60) (1) 625 18
Income tax provision 1,477 1,449 1,279 28 2 170 13
Segment income $ 2,592 $ 2,680 $ 2,225 $ (88) (3) % $ 455 20 %
Effective tax rate 36.3% 35.1% 36.5%
# denotes a variance greater than 100 percent.
42