American Express 2012 Annual Report Download - page 6
Download and view the complete annual report
Please find page 6 of the 2012 American Express annual report below. You can navigate through the pages in the report by either clicking on the pages listed below, or by using the keyword search tool below to find specific information within the annual report.-
 1
1 -
 2
2 -
 3
3 -
 4
4 -
 5
5 -
 6
6 -
 7
7 -
 8
8 -
 9
9 -
 10
10 -
 11
11 -
 12
12 -
 13
13 -
 14
14 -
 15
15 -
 16
16 -
 17
17 -
18
-
19
-
20
-
21
-
22
-
23
-
24
-
25
-
26
-
27
-
28
-
29
-
30
-
31
-
32
-
33
-
34
-
35
-
36
-
37
-
38
-
39
-
40
-
41
-
42
-
43
-
44
-
45
-
46
-
47
-
48
-
49
-
50
-
51
-
52
-
53
-
54
-
55
-
56
-
57
-
58
-
59
-
60
-
61
-
62
-
63
-
64
-
65
-
66
-
67
-
68
-
69
-
70
-
71
-
72
-
73
-
74
-
75
-
76
-
77
-
78
-
79
-
80
-
81
-
82
-
83
-
84
-
85
-
86
-
87
-
88
-
89
-
90
-
91
-
92
-
93
-
94
-
95
-
96
-
97
-
98
-
99
-
100
-
101
-
102
-
103
-
104
-
105
-
106
-
107
-
108
-
109
-
110
-
111
-
112
-
113
-
114
-
115
-
116
-
117
-
118
-
119
-
120
 |
 |

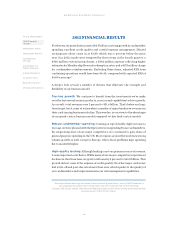
2012 FINANCIAL RESULTS
For the year, we posted net income of $4.5 billion on strong growth in cardmember
spending, excellent credit quality and careful expense management. Diluted
earnings per share came in at $3.89, which was 6 percent below the prior
year. Our 2012 results were tempered by three items in the fourth quarter: a
$400million restructuring charge, a $342 million expense refl ecting higher
estimates for Membership Rewards redemption rates, and a $153 million charge
for cardmember reimbursements. Excluding these items, adjusted EPS from
continuing operations would have been $4.40, compared with reported EPS of
$4.09 a year ago.*
A deeper look reveals a number of themes that illustrate the strength and
fl exibility of our business model.
Top-line growth: We continue to benefi t from the investments we’ve made
over the last several years in products, services and capabilities to drive growth.
As a result, total revenues rose 5 percent to $31.6 billion. That’s below our long-
term target, but it came at a time when a number of major banks saw revenues in
their card-issuing businesses decline. This was due, in our view, to the advantages
of our spend-centric business model compared to their lend-centric models.
Robust cardmember spending: Coming on top of double-digit increases a
year ago, we were pleased with the 8 percent rise in spending by our cardmembers.
By outgrowing most of our major competitors, we continued to gain share of
general purpose spending in the U.S. Most regions around the world saw strong
volume growth as well, except in Europe, where fi scal problems kept spending
fl at to modestly higher.
High-quality lending: Although lending is not our primary source of revenue,
it is an important contributor. While many of our major competitors experienced
declines in their loan base, we grew total loans by 4 percent to $65.2 billion. This
growth did not come at the expense of credit quality. No other major card issuer
had write-o and past-due rates lower than ours, which speaks to the quality of
our cardmembers and improvements in our risk management capabilities.
* Adjusted diluted earnings per share from continuing operations, a non-GAAP measure, is
calculated by excluding from diluted earnings per share the Q4’12 restructuring
charges ($0.25 per share), Membership Rewards expense ($0.19 per share) and cardmember
reimbursements ($0.07 per share).
To Our Shareholders
2012 Financial
Results
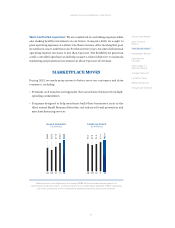
Marketplace Moves
Shareholder Returns
Foundational
Changes
Advantages in a
Digital Economy
A Broad Footprint
Customer Focus
Board of Directors
Change and Tradition
AMERICAN EXPRESS COMPANY
4