American Express 2012 Annual Report Download - page 47
Download and view the complete annual report
Please find page 47 of the 2012 American Express annual report below. You can navigate through the pages in the report by either clicking on the pages listed below, or by using the keyword search tool below to find specific information within the annual report.-
 1
1 -
2
-
3
-
4
-
5
-
6
-
7
-
8
-
9
-
10
-
11
-
12
-
13
-
14
-
15
-
16
-
17
-
18
-
19
-
20
-
21
-
22
-
23
-
24
-
25
-
26
-
27
-
28
-
29
-
30
-
31
-
32
-
33
-
34
-
35
-
36
-
 37
37 -
 38
38 -
 39
39 -
 40
40 -
 41
41 -
 42
42 -
 43
43 -
 44
44 -
 45
45 -
 46
46 -
 47
47 -
 48
48 -
 49
49 -
 50
50 -
 51
51 -
 52
52 -
 53
53 -
 54
54 -
 55
55 -
 56
56 -
 57
57 -
58
-
59
-
60
-
61
-
62
-
63
-
64
-
65
-
66
-
67
-
68
-
69
-
70
-
71
-
72
-
73
-
74
-
75
-
76
-
77
-
78
-
79
-
80
-
81
-
82
-
83
-
84
-
85
-
86
-
87
-
88
-
89
-
90
-
91
-
92
-
93
-
94
-
95
-
96
-
97
-
98
-
99
-
100
-
101
-
102
-
103
-
104
-
105
-
106
-
107
-
108
-
109
-
110
-
111
-
112
-
113
-
114
-
115
-
116
-
117
-
118
-
119
-
120
 |
 |

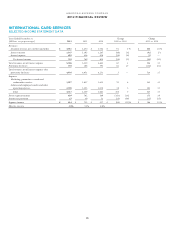
AMERICAN EXPRESS COMPANY
2012 FINANCIAL REVIEW
INTERNATIONAL CARD SERVICES
SELECTED INCOME STATEMENT DATA
Years Ended December 31,
(Millions, except percentages) 2012 2011 2010
Change
2012 vs. 2011
Change
2011 vs. 2010
Revenues
Discount revenue, net card fees and other $ 4,561 $ 4,470 $ 3,784 $ 91 2 % $ 686 18 %
Interest income 1,147 1,195 1,287 (48) (4) (92) (7)
Interest expense 402 426 428 (24) (6) (2) —
Net interest income 745 769 859 (24) (3) (90) (10)
Total revenues net of interest expense 5,306 5,239 4,643 67 1 596 13
Provisions for losses 330 268 392 62 23 (124) (32)
Total revenues net of interest expense after
provisions for losses 4,976 4,971 4,251 5 — 720 17
Expenses
Marketing, promotion, rewards and
cardmember services 1,927 1,857 1,612 70 4 245 15
Salaries and employee benefits and other
operating expenses 2,390 2,352 2,050 38 2 302 15
Total 4,317 4,209 3,662 108 3 547 15
Pretax segment income 659 762 589 (103) (14) 173 29
Income tax provision 25 39 52 (14) (36) (13) (25)
Segment income $ 634 $ 723 $ 537 $ (89) (12)% $ 186 35 %
Effective tax rate 3.8% 5.1% 8.8%
45