American Express 2012 Annual Report Download - page 71
Download and view the complete annual report
Please find page 71 of the 2012 American Express annual report below. You can navigate through the pages in the report by either clicking on the pages listed below, or by using the keyword search tool below to find specific information within the annual report.-
 1
1 -
2
-
3
-
4
-
5
-
6
-
7
-
8
-
9
-
10
-
11
-
12
-
13
-
14
-
15
-
16
-
17
-
18
-
19
-
20
-
21
-
22
-
23
-
24
-
25
-
26
-
27
-
28
-
29
-
30
-
31
-
32
-
33
-
34
-
35
-
36
-
37
-
38
-
39
-
40
-
41
-
42
-
43
-
44
-
45
-
46
-
47
-
48
-
49
-
50
-
51
-
52
-
53
-
54
-
55
-
56
-
57
-
58
-
59
-
60
-
 61
61 -
 62
62 -
 63
63 -
 64
64 -
 65
65 -
 66
66 -
 67
67 -
 68
68 -
 69
69 -
 70
70 -
 71
71 -
 72
72 -
 73
73 -
 74
74 -
 75
75 -
 76
76 -
 77
77 -
 78
78 -
 79
79 -
 80
80 -
 81
81 -
82
-
83
-
84
-
85
-
86
-
87
-
88
-
89
-
90
-
91
-
92
-
93
-
94
-
95
-
96
-
97
-
98
-
99
-
100
-
101
-
102
-
103
-
104
-
105
-
106
-
107
-
108
-
109
-
110
-
111
-
112
-
113
-
114
-
115
-
116
-
117
-
118
-
119
-
120
 |
 |

AMERICAN EXPRESS COMPANY
NOTES TO CONSOLIDATED FINANCIAL STATEMENTS
The Company monitors the market conditions and evaluates the
fair value hierarchy levels at least quarterly. For any transfers in
and out of the levels of the fair value hierarchy, the Company
elects to disclose the fair value measurement at the beginning of
the reporting period during which the transfer occurred.
Financial Assets and Financial Liabilities Carried at Fair Value
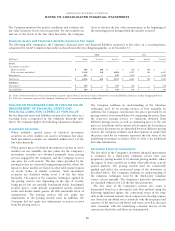
The following table summarizes the Company’s financial assets and financial liabilities measured at fair value on a recurring basis,
categorized by GAAP’s valuation hierarchy (as described in the preceding paragraphs), as of December 31:
2012 2011
(Millions) Total Level 1 Level 2 Total Level 1 Level 2
Assets:
Investment securities:(a)
Equity securities $ 296 $ 296 $ — $ 360 $ 360 $ —
Debt securities and other(b) 5,318 338 4,980 6,787 340 6,447
Derivatives(a) 942 — 942 1,516 — 1,516
Total assets $ 6,556 $ 634 $ 5,922 $ 8,663 $ 700 $ 7,963
Liabilities:
Derivatives(a) $ 329 $ — $ 329 $ 108 $ — $ 108
Total liabilities $ 329 $ — $ 329 $ 108 $ — $ 108
(a) Refer to Note 6 for the fair values of investment securities and to Note 12 for the fair values of derivative assets and liabilities, both on a further disaggregated basis.
(b) The Level 1 amounts represent the Company’s holdings of U.S. Government treasury obligations.
VALUATION TECHNIQUES USED IN THE FAIR VALUE
MEASUREMENT OF FINANCIAL ASSETS AND
FINANCIAL LIABILITIES CARRIED AT FAIR VALUE
For the financial assets and liabilities measured at fair value on a
recurring basis (categorized in the valuation hierarchy table
above) the Company applies the following valuation techniques:
Investment Securities
폷When available, quoted prices of identical investment
securities in active markets are used to determine fair value.
Such investment securities are classified within Level 1 of the
fair value hierarchy.
폷When quoted prices of identical investment securities in active
markets are not available, the fair values for the Company’s
investment securities are obtained primarily from pricing
services engaged by the Company, and the Company receives
one price for each security. The fair values provided by the
pricing services are estimated using pricing models, where the
inputs to those models are based on observable market inputs
or recent trades of similar securities. Such investment
securities are classified within Level 2 of the fair value
hierarchy. The inputs to the valuation techniques applied by
the pricing services vary depending on the type of security
being priced but are typically benchmark yields, benchmark
security prices, credit spreads, prepayment speeds, reported
trades and broker-dealer quotes, all with reasonable levels of
transparency. The pricing services did not apply any
adjustments to the pricing models used. In addition, the
Company did not apply any adjustments to prices received
from the pricing services.
The Company reaffirms its understanding of the valuation
techniques used by its pricing services at least annually. In
addition, the Company corroborates the prices provided by its
pricing services for reasonableness by comparing the prices from
the respective pricing services to valuations obtained from
different pricing sources as well as comparing prices to the sale
prices received from sold securities at least quarterly. In instances
where price discrepancies are identified between different pricing
sources, the Company evaluates such discrepancies to ensure that
the prices used for its valuation represent the fair value of the
underlying investment securities. Refer to Note 6 for additional
fair value information.
Derivative Financial Instruments
The fair value of the Company’s derivative financial instruments
is estimated by a third-party valuation service that uses
proprietary pricing models or by internal pricing models, where
the inputs to those models are readily observable from actively
quoted markets. The pricing models used are consistently
applied and reflect the contractual terms of the derivatives as
described below. The Company reaffirms its understanding of
the valuation techniques used by the third-party valuation
service at least annually. The Company’s derivative instruments
are classified within Level 2 of the fair value hierarchy.
The fair value of the Company’s interest rate swaps is
determined based on a discounted cash flow method using the
following significant inputs: the contractual terms of the swap
such as the notional amount, fixed coupon rate, floating coupon
rate (based on interbank rates consistent with the frequency and
currency of the interest cash flows) and tenor, as well as discount
rates consistent with the underlying economic factors of the
currency in which the cash flows are denominated.
69