American Express 2012 Annual Report Download - page 46
Download and view the complete annual report
Please find page 46 of the 2012 American Express annual report below. You can navigate through the pages in the report by either clicking on the pages listed below, or by using the keyword search tool below to find specific information within the annual report.-
 1
1 -
2
-
3
-
4
-
5
-
6
-
7
-
8
-
9
-
10
-
11
-
12
-
13
-
14
-
15
-
16
-
17
-
18
-
19
-
20
-
21
-
22
-
23
-
24
-
25
-
26
-
27
-
28
-
29
-
30
-
31
-
32
-
33
-
34
-
35
-
 36
36 -
 37
37 -
 38
38 -
 39
39 -
 40
40 -
 41
41 -
 42
42 -
 43
43 -
 44
44 -
 45
45 -
 46
46 -
 47
47 -
 48
48 -
 49
49 -
 50
50 -
 51
51 -
 52
52 -
 53
53 -
 54
54 -
 55
55 -
 56
56 -
57
-
58
-
59
-
60
-
61
-
62
-
63
-
64
-
65
-
66
-
67
-
68
-
69
-
70
-
71
-
72
-
73
-
74
-
75
-
76
-
77
-
78
-
79
-
80
-
81
-
82
-
83
-
84
-
85
-
86
-
87
-
88
-
89
-
90
-
91
-
92
-
93
-
94
-
95
-
96
-
97
-
98
-
99
-
100
-
101
-
102
-
103
-
104
-
105
-
106
-
107
-
108
-
109
-
110
-
111
-
112
-
113
-
114
-
115
-
116
-
117
-
118
-
119
-
120
 |
 |
AMERICAN EXPRESS COMPANY
2012 FINANCIAL REVIEW
RESULTS OF OPERATIONS FOR THE THREE YEARS
ENDED DECEMBER 31, 2012
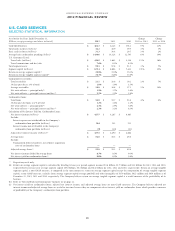
USCS segment income decreased $88 million or 3 percent in
2012 as compared to the prior year. USCS segment income
increased $455 million or 20 percent in 2011 as compared to the
prior year.
Total Revenues Net of Interest Expense
Total revenues net of interest expense increased $975 million or
6 percent in 2012 as compared to the prior year, primarily driven
by higher discount revenue, increased net interest income, higher
other revenues and higher net card fees.
Discount revenue, net card fees and other revenues increased
$665 million or 6 percent in 2012 as compared to the prior year,
primarily due to higher discount revenue resulting from billed
business growth, partially offset by higher contra-revenues
primarily related to cash rebates tied to volume growth on cash-
back rewards products. Billed business increased 9 percent in
2012 as compared to the prior year, primarily driven by 6 percent
increase in average spending per proprietary basic cards-in-force
and 3 percent higher cards-in-force.
Interest income increased $268 million or 5 percent in 2012 as
compared to the prior year, primarily due to a 5 percent increase
in average cardmember loans and a slight increase in the net
interest yield on cardmember loans.
Interest expense decreased $42 million or 5 percent in 2012 as
compared to the prior year, reflecting a lower cost of funds,
partially offset by higher average cardmember receivable and
loan balances.
Total revenues net of interest expense increased $609 million
or 4 percent in 2011 as compared to the prior year, due to higher
discount revenue, net card fees and other revenues and a
decrease in interest expense, partially offset by a decrease in
interest income.
Provisions for Losses
Provisions for losses increased $742 million or over 100 percent
in 2012 as compared to the prior year, primarily reflecting a
smaller reserve release in 2012 than in 2011 due to the slowing
pace of improved credit conditions. The provisions for losses
increase was partially offset by lower net write-offs due to
improved cardmember lending credit trends in the current
period.
Provisions for losses decreased $904 million or 57 percent in
2011 as compared to the prior year, principally reflecting lower
reserve requirements driven by improving cardmember loan
trends, partially offset by a higher charge card provision resulting
from higher cardmember receivable balances and a higher net
write-off rate.
Refer to the USCS Selected Statistical Information table for the
lending and charge write-off rates for 2012, 2011 and 2010.
Expenses
Expenses increased $293 million or 3 percent in 2012 as
compared to the prior year, primarily due to higher salaries and
employee benefits and other operating expenses, partially offset
by lower marketing, promotion, rewards and cardmember
services expenses. Expenses included a reengineering net charge
of $29 million in 2012, a net benefit of $8 million in 2011 and a
net charge of $55 million in 2010. Expenses increased $888
million or 9 percent in 2011 as compared to the prior year, due
to increased marketing, promotion, rewards and cardmember
services expenses, and higher salaries and employee benefits and
other operating expenses.
Marketing, promotion, rewards and cardmember services
expenses decreased $41 million or 1 percent in 2012 as compared
to the prior year, due to lower marketing, promotion and
rewards expenses, partially offset by higher cardmember services
expenses. Marketing, promotion, rewards and cardmember
services expenses increased $849 million or 15 percent in 2011 as
compared to the prior year, due to higher rewards and
cardmember services expenses.
Cardmember rewards expenses decreased $33 million or 1
percent in 2012 as compared to the prior year due to a decrease
in Membership Rewards expense of $108 million offset by an
increase in co-brand rewards expense of $75 million.
For 2012, Membership Rewards expenses decreased $108
million as compared to the prior year as a result of a reduction in
expenses related to a slower average URR growth rate (including
the effect of enhancements to the U.S. URR estimation process of
$317 million in 2012 and $188 million in 2011) and a shift in the
redemption mix which drove a favorable change in the WAC
assumption, offset by higher expenses relating to an increase in
new points earned. Co-brand rewards expenses increased $75
million primarily related to higher spending volumes.
For 2011, Membership Rewards expenses increased $736
million as compared to the prior year as a result of higher
expenses related to an increase in new points earned, an increase
in expenses related to a higher average URR growth rate
(including the effects of enhancements to the U.S. URR
estimation process of $188 million) and a shift in the redemption
mix resulting in a higher WAC assumption. Co-brand rewards
expenses increased $211 million primarily related to higher
spending volumes.
Salaries and employee benefits and other operating expenses
increased $334 million or 9 percent in 2012 as compared to the
prior year, primarily driven by higher other operating expenses
related to cardmember reimbursement costs as a result of
internal and regulatory reviews of the Company’s U.S. banking
subsidiaries, an increase in expenses related to hedge
ineffectiveness and higher restructuring charges. Salaries and
employee benefits and other operating expenses increased $39
million or 1 percent in 2011 as compared to the prior year,
primarily reflecting increased salary and employee benefits costs,
partially offset by higher reengineering expense in the prior year.
Income Taxes
The tax rate in all periods reflected the benefits from the
resolution of certain prior years’ tax items and the relationship of
recurring permanent tax benefits to varying levels of pretax
income.
44