American Express 2012 Annual Report Download - page 48
Download and view the complete annual report
Please find page 48 of the 2012 American Express annual report below. You can navigate through the pages in the report by either clicking on the pages listed below, or by using the keyword search tool below to find specific information within the annual report.-
 1
1 -
2
-
3
-
4
-
5
-
6
-
7
-
8
-
9
-
10
-
11
-
12
-
13
-
14
-
15
-
16
-
17
-
18
-
19
-
20
-
21
-
22
-
23
-
24
-
25
-
26
-
27
-
28
-
29
-
30
-
31
-
32
-
33
-
34
-
35
-
36
-
37
-
 38
38 -
 39
39 -
 40
40 -
 41
41 -
 42
42 -
 43
43 -
 44
44 -
 45
45 -
 46
46 -
 47
47 -
 48
48 -
 49
49 -
 50
50 -
 51
51 -
 52
52 -
 53
53 -
 54
54 -
 55
55 -
 56
56 -
 57
57 -
 58
58 -
59
-
60
-
61
-
62
-
63
-
64
-
65
-
66
-
67
-
68
-
69
-
70
-
71
-
72
-
73
-
74
-
75
-
76
-
77
-
78
-
79
-
80
-
81
-
82
-
83
-
84
-
85
-
86
-
87
-
88
-
89
-
90
-
91
-
92
-
93
-
94
-
95
-
96
-
97
-
98
-
99
-
100
-
101
-
102
-
103
-
104
-
105
-
106
-
107
-
108
-
109
-
110
-
111
-
112
-
113
-
114
-
115
-
116
-
117
-
118
-
119
-
120
 |
 |

AMERICAN EXPRESS COMPANY
2012 FINANCIAL REVIEW
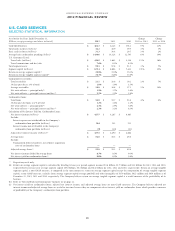
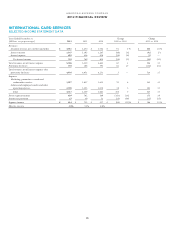
INTERNATIONAL CARD SERVICES
SELECTED STATISTICAL INFORMATION
As of or for the Years Ended December 31,
(Billions, except percentages and where indicated) 2012 2011 2010
Change
2012 vs. 2011
Change
2011 vs. 2010
Card billed business $ 128.9 $ 124.2 $ 107.9 4% 15 %
Total cards-in-force (millions) 15.6 15.3 15.0 2% 2 %
Basic cards-in-force (millions) 10.6 10.5 10.4 1% 1 %
Average basic cardmember spending (dollars)*$ 12,221 $ 11,935 $ 10,366 2% 15 %
International Consumer Travel:
Travel sales (millions) $ 1,372 $ 1,324 $ 1,126 4% 18 %
Travel commissions and fees/sales 7.2% 7.8% 8.0%
Total segment assets $ 31.8 $ 29.1 $ 25.3 9% 15 %
Segment capital (millions) $ 2,875 $ 2,840 $ 2,199 1% 29 %
Return on average segment capital(a) 21.8% 25.8% 25.1%
Return on average tangible segment capital(a) 43.0% 49.8% 34.8%
Cardmember receivables:
Total receivables $7.8$ 7.2 $ 6.7 8% 7 %
90 days past billing as a % of total 0.9% 0.9% 1.0%
Netlossratio(asa%ofchargevolume) 0.16% 0.15% 0.24%
Cardmember loans:
Total loans $9.2$ 8.9 $ 9.3 3% (4)%
30 days past due loans as a % of total 1.5% 1.7% 2.3%
Net write-off rate — principal only(b) 1.9% 2.7% 4.6%
Net write-off rate — principal, interest and fees(b) 2.4% 3.3% 5.5%
Calculation of Net Interest Yield on Cardmember Loans:
Net interest income (millions) $ 745 $ 769 $ 859
Exclude:
Interest expense not attributable to the Company’s
cardmember loan portfolio (millions) 102 125 124
Interest income not attributable to the Company’s
cardmember loan portfolio (millions) (25) (38) (38)
Adjusted net interest income (millions)(c) $ 822 $ 856 $ 945
Average loans $8.7$ 8.8 $ 8.6
Exclude:
Unamortized deferred card fees, net of direct acquisition
costs of cardmember loans, and other (0.2) (0.1) (0.1)
Adjusted average loans(c) $8.5$ 8.7 $ 8.5
Net interest income divided by average loans 8.5% 8.8% 10.0%
Net interest yield on cardmember loans(c) 9.6% 9.9% 11.1%
* Proprietary cards only.
(a) Return on average segment capital is calculated by dividing (i) one-year period segment income ($634 million, $723 million and $537 million for 2012, 2011 and
2010, respectively) by (ii) one-year average segment capital ($2.9 billion, $2.8 billion and $2.1 billion for 2012, 2011 and 2010, respectively). Return on average
tangible segment capital, a non-GAAP measure, is computed in the same manner as return on average segment capital except the computation of average tangible
segment capital, a non-GAAP measure, excludes from average segment capital average goodwill and other intangibles of $1.4 billion, $1.3 billion and $592 million as
of December 31, 2012, 2011 and 2010, respectively. The Company believes return on average tangible segment capital is a useful measure of the profitability of its
business.
(b) Refer to “Selected Statistical Information” footnote (e) on page 22.
(c) Net interest yield on cardmember loans, adjusted net interest income and adjusted average loans are non-GAAP measures. The Company believes adjusted net interest
income and adjusted average loans are useful to investors because they are components of net interest yield on cardmember loans, which provides a measure of
profitability of the Company’s cardmember loan portfolio.
46