American Express 2012 Annual Report Download - page 53
Download and view the complete annual report
Please find page 53 of the 2012 American Express annual report below. You can navigate through the pages in the report by either clicking on the pages listed below, or by using the keyword search tool below to find specific information within the annual report.-
 1
1 -
2
-
3
-
4
-
5
-
6
-
7
-
8
-
9
-
10
-
11
-
12
-
13
-
14
-
15
-
16
-
17
-
18
-
19
-
20
-
21
-
22
-
23
-
24
-
25
-
26
-
27
-
28
-
29
-
30
-
31
-
32
-
33
-
34
-
35
-
36
-
37
-
38
-
39
-
40
-
41
-
42
-
 43
43 -
 44
44 -
 45
45 -
 46
46 -
 47
47 -
 48
48 -
 49
49 -
 50
50 -
 51
51 -
 52
52 -
 53
53 -
 54
54 -
 55
55 -
 56
56 -
 57
57 -
 58
58 -
 59
59 -
 60
60 -
 61
61 -
 62
62 -
 63
63 -
64
-
65
-
66
-
67
-
68
-
69
-
70
-
71
-
72
-
73
-
74
-
75
-
76
-
77
-
78
-
79
-
80
-
81
-
82
-
83
-
84
-
85
-
86
-
87
-
88
-
89
-
90
-
91
-
92
-
93
-
94
-
95
-
96
-
97
-
98
-
99
-
100
-
101
-
102
-
103
-
104
-
105
-
106
-
107
-
108
-
109
-
110
-
111
-
112
-
113
-
114
-
115
-
116
-
117
-
118
-
119
-
120
 |
 |
AMERICAN EXPRESS COMPANY
2012 FINANCIAL REVIEW
RESULTS OF OPERATIONS FOR THE THREE YEARS
ENDED DECEMBER 31, 2012
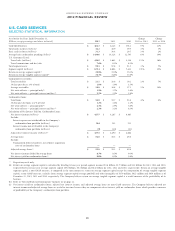
GNMS segment income increased $150 million or 12 percent in
2012 as compared to the prior year. GNMS segment income
increased $268 million or 26 percent in 2011 as compared to the
prior year.
Total Revenues Net of Interest Expense
Total revenues net of interest expense increased $329 million or
7 percent in 2012 as compared to the prior year, primarily due to
higher discount revenue, net card fees and other revenues and
higher net interest income.
Discount revenue, net card fees and other revenues increased
$292 million or 6 percent in 2012 as compared to the prior year.
The increase reflects higher merchant-related revenues, driven by
an 8 percent increase in global card billed business volumes, as
well as higher GNS revenues.
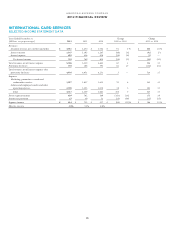
Interest expense credit increased $19 million or 8 percent in
2012 as compared to the prior year, in line with higher merchant
accounts payable, which are funded primarily through
intercompany transfer pricing agreements with card issuers.
Total revenues net of interest expense increased $637 million
or 15 percent in 2011 as compared to the prior year, due to
higher discount revenue, net card fees and other revenues and a
higher interest expense credit.
Provisions for Losses
Provisions for losses decreased $1 million or 1 percent in 2012 as
compared to the prior year. Provisions for losses increased $14
million or 23 percent in 2011 as compared to the prior year,
primarily due to higher merchant-related debit balances.
Expenses
Expenses increased $90 million or 3 percent in 2012 as compared
to the prior year, primarily due to higher salaries and employee
benefits and other operating expenses, partially offset by lower
marketing, promotion, rewards and cardmember services
expenses. Expenses in 2012, 2011 and 2010 included $31 million,
$11 million and $18 million, respectively, of net reengineering
charges. Expenses increased $233 million or 9 percent in 2011 as
compared to the prior year, due to higher salaries and employee
benefits and other operating expenses.
Marketing, promotion, rewards and cardmember services
expenses decreased $11 million or 1 percent in 2012 as compared
to the prior year, reflecting lower marketing and promotion
expenses. Marketing, promotion, rewards and cardmember
services expenses were flat in 2011 as compared to the prior year.
Salaries and employee benefits and other operating expenses
increased $101 million or 5 percent in 2012 as compared to the
prior year, primarily due to higher professional services costs and
increases in salary and employee benefits costs, partially offset by
other operating expenses. Salaries and employee benefits and
other operating expenses increased $233 million or 12 percent in
2011 as compared to the prior year, primarily due to increases in
salary and employee benefits costs, greater third-party merchant
sales force commissions and higher legal costs.
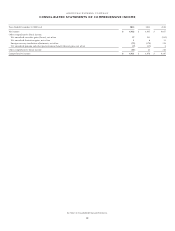
CORPORATE & OTHER
Corporate & Other had net after-tax expense of $831 million,
$535 million and $180 million in 2012, 2011 and 2010,
respectively. Net after-tax expense in 2012 reflected an increase
in reengineering costs, partially offset by gains on sales of
investment securities and the favorable effects of revised
estimates of the liability for uncashed international Travelers
Cheques. Results in 2011 and 2010 reflected $186 million and
$372 million of after-tax income related to the MasterCard
litigation settlement, respectively, and $172 million of after-tax
income for both 2011 and 2010 related to the Visa litigation
settlement. The Company no longer receives payments on the
MasterCard and Visa litigation settlements. After-tax costs of
$109 million, $49 million and $2 million for 2012, 2011 and
2010, respectively, were related to the Company’s reengineering
initiatives.
Net after-tax expense in 2011 reflected various investment
initiatives and expenses related to legal exposures, partially offset
by higher global prepaid income.
Net after-tax expense in 2010 reflected higher incentive
compensation and benefit reinstatement-related expenses, and
various investments in the Global Prepaid business and
Enterprise Growth initiatives.
Results for all periods disclosed also included net interest
expense related to maintaining the liquidity pool discussed in
“Consolidated Capital Resources and Liquidity — Liquidity
Management” above, as well as interest expense related to other
corporate indebtedness.
51