American Express 2012 Annual Report Download - page 50
Download and view the complete annual report
Please find page 50 of the 2012 American Express annual report below. You can navigate through the pages in the report by either clicking on the pages listed below, or by using the keyword search tool below to find specific information within the annual report.-
 1
1 -
2
-
3
-
4
-
5
-
6
-
7
-
8
-
9
-
10
-
11
-
12
-
13
-
14
-
15
-
16
-
17
-
18
-
19
-
20
-
21
-
22
-
23
-
24
-
25
-
26
-
27
-
28
-
29
-
30
-
31
-
32
-
33
-
34
-
35
-
36
-
37
-
38
-
39
-
 40
40 -
 41
41 -
 42
42 -
 43
43 -
 44
44 -
 45
45 -
 46
46 -
 47
47 -
 48
48 -
 49
49 -
 50
50 -
 51
51 -
 52
52 -
 53
53 -
 54
54 -
 55
55 -
 56
56 -
 57
57 -
 58
58 -
 59
59 -
 60
60 -
61
-
62
-
63
-
64
-
65
-
66
-
67
-
68
-
69
-
70
-
71
-
72
-
73
-
74
-
75
-
76
-
77
-
78
-
79
-
80
-
81
-
82
-
83
-
84
-
85
-
86
-
87
-
88
-
89
-
90
-
91
-
92
-
93
-
94
-
95
-
96
-
97
-
98
-
99
-
100
-
101
-
102
-
103
-
104
-
105
-
106
-
107
-
108
-
109
-
110
-
111
-
112
-
113
-
114
-
115
-
116
-
117
-
118
-
119
-
120
 |
 |

AMERICAN EXPRESS COMPANY
2012 FINANCIAL REVIEW
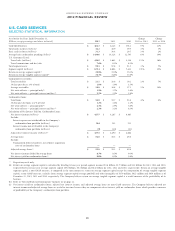
GLOBAL COMMERCIAL SERVICES
SELECTED INCOME STATEMENT DATA
Years Ended December 31,
(Millions, except percentages) 2012 2011 2010
Change
2012 vs. 2011
Change
2011 vs. 2010
Revenues
Discount revenue, net card fees and other $ 4,995 $ 4,880 $ 4,347 $ 115 2 % $ 533 12 %
Interest income 11 97222 229
Interest expense 257 264 227 (7) (3) 37 16
Net interest expense (246) (255) (220) (9) (4) 35 16
Total revenues net of interest expense 4,749 4,625 4,127 124 3 498 12
Provisions for losses 136 76 157 60 79 (81) (52)
Total revenues net of interest expense after
provisions for losses 4,613 4,549 3,970 64 1 579 15
Expenses
Marketing, promotion, rewards and
cardmember services 579 547 439 32 6 108 25
Salaries and employee benefits and other
operating expenses 3,074 2,927 2,808 147 5 119 4
Total 3,653 3,474 3,247 179 5 227 7
Pretax segment income 960 1,075 723 (115) (11) 352 49
Income tax provision 316 337 273 (21) (6) 64 23
Segment income $ 644 $ 738 $ 450 $ (94) (13)% $ 288 64 %
Effective tax rate 32.9% 31.3% 37.8%
SELECTED STATISTICAL INFORMATION
As of or for the Years Ended December 31,
(Billions, except percentages and where indicated) 2012 2011 2010
Change
2012 vs. 2011
Change
2011 vs. 2010
Card billed business $ 166.4 $ 154.2 $ 132.8 8 % 16 %
Total cards-in-force (millions) 7.0 7.0 7.1 — % (1)%
Basic cards-in-force (millions) 7.0 7.0 7.1 — % (1)%
Average basic cardmember spending (dollars)*$ 23,737 $ 21,898 $ 18,927 8 % 16 %
Global Corporate Travel:
Travel sales (millions) $ 18,894 $ 19,618 $ 17,460 (4)% 12 %
Travel commissions and fees/sales 8.1% 8.0% 8.2%
Total segment assets $ 18.9 $ 18.8 $ 18.1 1 % 4 %
Segment capital (millions) $ 3,625 $ 3,564 $ 3,650 2 % (2)%
Return on average segment capital(a) 17.6% 20.4% 12.6%
Return on average tangible segment capital(a) 35.1% 42.1% 27.1%
Cardmember receivables:
Total receivables $ 13.7 $ 12.8 $ 11.3 7 % 13 %
90 days past billing as a % of total 0.8% 0.8% 0.8%
Netlossratio(asa%ofchargevolume) 0.06% 0.06% 0.11%
* Proprietary cards only.
(a) Return on average segment capital is calculated by dividing (i) one-year period segment income ($644 million, $738 million and $450 million for 2012, 2011 and
2010, respectively) by (ii) one-year average segment capital ($3.6 billion for each of the years 2012, 2011 and 2010). Return on average tangible segment capital, a
non-GAAP measure, is computed in the same manner as return on average segment capital except the computation of average tangible segment capital, a non-GAAP
measure, excludes from average segment capital average goodwill and other intangibles of $1.8 billion at December 31, 2012 and $1.9 billion at both December 31,
2011 and 2010. The Company believes return on average tangible segment capital is a useful measure of the profitability of its business.
48