American Express 2012 Annual Report Download - page 49
Download and view the complete annual report
Please find page 49 of the 2012 American Express annual report below. You can navigate through the pages in the report by either clicking on the pages listed below, or by using the keyword search tool below to find specific information within the annual report.-
 1
1 -
2
-
3
-
4
-
5
-
6
-
7
-
8
-
9
-
10
-
11
-
12
-
13
-
14
-
15
-
16
-
17
-
18
-
19
-
20
-
21
-
22
-
23
-
24
-
25
-
26
-
27
-
28
-
29
-
30
-
31
-
32
-
33
-
34
-
35
-
36
-
37
-
38
-
 39
39 -
 40
40 -
 41
41 -
 42
42 -
 43
43 -
 44
44 -
 45
45 -
 46
46 -
 47
47 -
 48
48 -
 49
49 -
 50
50 -
 51
51 -
 52
52 -
 53
53 -
 54
54 -
 55
55 -
 56
56 -
 57
57 -
 58
58 -
 59
59 -
60
-
61
-
62
-
63
-
64
-
65
-
66
-
67
-
68
-
69
-
70
-
71
-
72
-
73
-
74
-
75
-
76
-
77
-
78
-
79
-
80
-
81
-
82
-
83
-
84
-
85
-
86
-
87
-
88
-
89
-
90
-
91
-
92
-
93
-
94
-
95
-
96
-
97
-
98
-
99
-
100
-
101
-
102
-
103
-
104
-
105
-
106
-
107
-
108
-
109
-
110
-
111
-
112
-
113
-
114
-
115
-
116
-
117
-
118
-
119
-
120
 |
 |

AMERICAN EXPRESS COMPANY
2012 FINANCIAL REVIEW
RESULTS OF OPERATIONS FOR THE THREE YEARS
ENDED DECEMBER 31, 2012
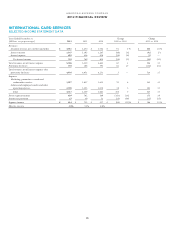
ICS segment income decreased $89 million or 12 percent in 2012
as compared to the prior year. ICS segment income increased
$186 million or 35 percent in 2011 as compared to the prior year.
Total Revenues Net of Interest Expense
Total revenues net of interest expense increased $67 million or 1
percent in 2012 as compared to the prior year, primarily due to
higher discount revenue, net card fees and other revenues,
partially offset by lower net interest income.
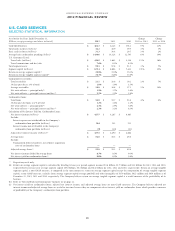
Discount revenue, net card fees and other revenues increased
$91 million or 2 percent in 2012 as compared to the prior year,
primarily due to higher cardmember spending and fee revenues
related to Loyalty Partner, higher conversion revenue and higher
discount revenue. Assuming no changes in foreign exchange
rates, discount revenue, net card fees and other revenues
increased 5 percent in 2012 as compared to the prior year.3
Billed business increased 4 percent in 2012 as compared to the
prior year, primarily reflecting a 2 percent increase in average
spending per proprietary basic cards-in-force. Refer to the
Consolidated Selected Statistical Information table on page 24
for additional information on billed business by region.
Interest income decreased $48 million or 4 percent in 2012 as
compared to the prior year, reflecting a lower yield on
cardmember loans.
Interest expense decreased $24 million or 6 percent in 2012 as
compared to the prior year, reflecting a lower cost of funds.
Total revenues net of interest expense increased $596 million
or 13 percent in 2011 as compared to the prior year, primarily
due to higher discount revenue, net card fees and other revenues,
partially offset by lower interest income.
Provisions for Losses
Provisions for losses increased $62 million or 23 percent in 2012
as compared to the prior year, primarily driven by higher
cardmember lending provisions due to lower reserve releases in
the current period, partially offset by lower charge card
provisions and lower cardmember lending net write-off rates.
Provisions for losses decreased $124 million or 32 percent in
2011 as compared to the prior year, primarily reflecting lower
reserve requirements due to improving cardmember loan and
charge card credit trends, partially offset by a larger charge card
provision expense driven by higher average receivable balances.
Refer to the ICS Selected Statistical Information table for the
lending and charge write-off rates for 2012, 2011 and 2010.
3Refer to footnote 1 on page 25 relating to changes in foreign exchange rates.
Expenses
Expenses increased $108 million or 3 percent in 2012 as
compared to the prior year, due to higher marketing, promotion,
rewards and cardmember services expenses and higher salaries
and employee benefits and other operating expenses. Expenses in
2012, 2011 and 2010 included $63 million, $36 million and $19
million, respectively, of net reengineering charges. Expenses
increased $547 million or 15 percent in 2011 as compared to the
prior year, due to higher marketing, promotion, rewards and
cardmember services expenses and higher salaries and employee
benefits and other operating expenses.
Marketing, promotion, rewards and cardmember services
expenses increased $70 million or 4 percent in 2012 as compared
to the prior year, driven by higher volume-related rewards costs
and co-brand expenses and higher cardmember services
expenses, partially offset by lower marketing and promotion
expenses. Marketing, promotion, rewards and cardmember
services expenses increased $245 million or 15 percent in 2011 as
compared to the prior year, primarily due to greater volume-
related rewards costs and co-brand expenses and the inclusion of
the Loyalty Partner business.
Salaries and employee benefits and other operating expenses
increased $38 million or 2 percent in 2012 as compared to the
prior year, primarily due to higher restructuring charges,
partially offset by lower other operating expenses. Salaries and
employee benefits and other operating expenses increased $302
million or 15 percent in 2011 as compared to the prior year,
reflecting the inclusion of Loyalty Partner expenses, as well as
increased salary and employee benefits costs.
Income Taxes
The tax rate in all periods reflected the recurring permanent tax
benefit related to the segment’s ongoing funding activities
outside the United States, which is allocated to ICS under the
Company’s internal tax allocation process. The tax rates for 2012
and 2011 also reflected the allocated share of tax benefits related
to the realization of certain foreign tax credits, and the tax rate
for 2010 reflected a benefit from the resolution of certain prior
years’ items. In addition, the tax rate in each of the periods
reflected the impact of recurring permanent tax benefits on
varying levels of pretax income.
47