American Express 2012 Annual Report Download - page 72
Download and view the complete annual report
Please find page 72 of the 2012 American Express annual report below. You can navigate through the pages in the report by either clicking on the pages listed below, or by using the keyword search tool below to find specific information within the annual report.-
 1
1 -
2
-
3
-
4
-
5
-
6
-
7
-
8
-
9
-
10
-
11
-
12
-
13
-
14
-
15
-
16
-
17
-
18
-
19
-
20
-
21
-
22
-
23
-
24
-
25
-
26
-
27
-
28
-
29
-
30
-
31
-
32
-
33
-
34
-
35
-
36
-
37
-
38
-
39
-
40
-
41
-
42
-
43
-
44
-
45
-
46
-
47
-
48
-
49
-
50
-
51
-
52
-
53
-
54
-
55
-
56
-
57
-
58
-
59
-
60
-
61
-
 62
62 -
 63
63 -
 64
64 -
 65
65 -
 66
66 -
 67
67 -
 68
68 -
 69
69 -
 70
70 -
 71
71 -
 72
72 -
 73
73 -
 74
74 -
 75
75 -
 76
76 -
 77
77 -
 78
78 -
 79
79 -
 80
80 -
 81
81 -
 82
82 -
83
-
84
-
85
-
86
-
87
-
88
-
89
-
90
-
91
-
92
-
93
-
94
-
95
-
96
-
97
-
98
-
99
-
100
-
101
-
102
-
103
-
104
-
105
-
106
-
107
-
108
-
109
-
110
-
111
-
112
-
113
-
114
-
115
-
116
-
117
-
118
-
119
-
120
 |
 |

AMERICAN EXPRESS COMPANY
NOTES TO CONSOLIDATED FINANCIAL STATEMENTS
The fair value of the Company’s total return contract, which
serves as a hedge against the Hong Kong dollar (HKD) change in
fair value associated with the Company’s investment in the
Industrial and Commercial Bank of China (ICBC), is determined
based on a discounted cash flow method using the following
significant inputs as of the valuation date: number of shares of
the Company’s underlying ICBC investment, the quoted market
price of the shares in HKD and the monthly settlement terms of
the contract inclusive of price and tenor.
The fair value of foreign exchange forward contracts is
determined based on a discounted cash flow method using the
following significant inputs: the contractual terms of the forward
contracts such as the notional amount, maturity dates and
contract rate, as well as relevant foreign currency forward curves,
and discount rates consistent with the underlying economic
factors of the currency in which the cash flows are denominated.
Credit valuation adjustments are necessary when the market
parameters, such as a benchmark curve, used to value derivatives
are not indicative of the credit quality of the Company or its
counterparties. The Company considers the counterparty credit
risk by applying an observable forecasted default rate to the
current exposure. Refer to Note 12 for additional fair value
information.
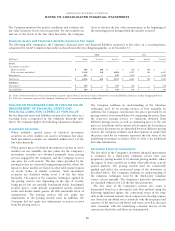
Financial Assets and Financial Liabilities Carried at Other Than Fair Value
ThefollowingtabledisclosestheestimatedfairvaluefortheCompany’s financial assets and financial liabilities that are not required to
be carried at fair value on a recurring basis, as of December 31, 2012 and 2011:
Carrying
Value
Corresponding Fair Value Amount
2012 (Billions) Total Level 1 Level 2 Level 3
Financial Assets:
Financial assets for which carrying values equal or approximate fair value
Cash and cash equivalents $22$22$21$ 1
(a) $—
Other financial assets(b) $47$47$—$47$—
Financial assets carried at other than fair value
Loans, net $64$65
(c) $—$—$65
Financial Liabilities:
Financial liabilities for which carrying values equal or approximate fair value $55$55$—$55$—
Financial liabilities carried at other than fair value
Certificates of deposit(d) $10$10$—$10$—
Long-term debt $59$62
(c) $—$62$—
2011 (Billions)
Carrying
Value
Fair
Value
Financial Assets:
Financial assets for which carrying values equal or approximate fair value
Cash and cash equivalents $ 25 $ 25
Other financial assets(b) $45$45
Financial assets carried at other than fair value
Loans, net $ 61 $ 62(c)
Financial Liabilities:
Financial liabilities for which carrying values equal or approximate fair value $ 51 $ 51
Financial liabilities carried at other than fair value
Certificates of deposit(d) $12$12
Long-term debt $ 59 $ 62(c)
(a) Reflects time deposits.
(b) Includes accounts receivables (including fair values of cardmember receivables of $8.0 billion held by consolidated VIEs as of December 31, 2012 and 2011,
respectively), restricted cash and other miscellaneous assets.
(c) Includes fair values of loans of $32.4 billion and $33.3 billion, respectively, and long-term debt of $19.5 billion and $21.1 billion, respectively, held by consolidated
VIEs as of December 31, 2012 and 2011.
(d) Presented as a component of customer deposits on the Consolidated Balance Sheets.
70