American Express 2012 Annual Report Download - page 64
Download and view the complete annual report
Please find page 64 of the 2012 American Express annual report below. You can navigate through the pages in the report by either clicking on the pages listed below, or by using the keyword search tool below to find specific information within the annual report.-
 1
1 -
2
-
3
-
4
-
5
-
6
-
7
-
8
-
9
-
10
-
11
-
12
-
13
-
14
-
15
-
16
-
17
-
18
-
19
-
20
-
21
-
22
-
23
-
24
-
25
-
26
-
27
-
28
-
29
-
30
-
31
-
32
-
33
-
34
-
35
-
36
-
37
-
38
-
39
-
40
-
41
-
42
-
43
-
44
-
45
-
46
-
47
-
48
-
49
-
50
-
51
-
52
-
53
-
 54
54 -
 55
55 -
 56
56 -
 57
57 -
 58
58 -
 59
59 -
 60
60 -
 61
61 -
 62
62 -
 63
63 -
 64
64 -
 65
65 -
 66
66 -
 67
67 -
 68
68 -
 69
69 -
 70
70 -
 71
71 -
 72
72 -
 73
73 -
 74
74 -
75
-
76
-
77
-
78
-
79
-
80
-
81
-
82
-
83
-
84
-
85
-
86
-
87
-
88
-
89
-
90
-
91
-
92
-
93
-
94
-
95
-
96
-
97
-
98
-
99
-
100
-
101
-
102
-
103
-
104
-
105
-
106
-
107
-
108
-
109
-
110
-
111
-
112
-
113
-
114
-
115
-
116
-
117
-
118
-
119
-
120
 |
 |

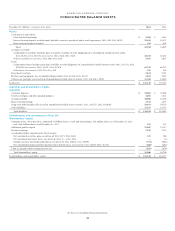
AMERICAN EXPRESS COMPANY
CONSOLIDATED BALANCE SHEETS
December 31 (Millions, except per share data) 2012 2011
Assets
Cash and cash equivalents
Cash and due from banks $ 2,020 $ 3,514
Interest-bearing deposits in other banks (includes securities purchased under resale agreements: 2012, $58; 2011, $470) 19,892 20,572
Short-term investment securities 338 807
Total 22,250 24,893
Accounts receivable
Cardmember receivables (includes gross receivables available to settle obligations of a consolidated variable interest entity:
2012, $8,012; 2011, $8,027), less reserves: 2012, $428; 2011, $438 42,338 40,452
Other receivables, less reserves: 2012, $86; 2011, $102 3,576 3,657
Loans
Cardmember loans (includes gross loans available to settle obligations of a consolidated variable interest entity: 2012, $32,731; 2011,
$33,834), less reserves: 2012, $1,471; 2011, $1,874 63,758 60,747
Other loans, less reserves: 2012, $20; 2011, $18 551 419
Investment securities 5,614 7,147
Premises and equipment, less accumulated depreciation: 2012, $5,429; 2011, $4,747 3,635 3,367
Other assets (includes restricted cash of consolidated variable interest entities: 2012, $76; 2011, $207) 11,418 12,655
Total assets $ 153,140 $ 153,337
Liabilities and Shareholders’ Equity
Liabilities
Customer deposits $ 39,803 $ 37,898
Travelers Cheques and other prepaid products 4,601 5,123
Accounts payable 10,006 10,458
Short-term borrowings 3,314 4,337
Long-term debt (includes debt issued by consolidated variable interest entities: 2012, $19,277; 2011, $20,856) 58,973 59,570
Other liabilities 17,557 17,157
Total liabilities $ 134,254 $ 134,543
Commitments and contingencies (Note 24)
Shareholders’ Equity
Common shares, $0.20 par value, authorized 3.6 billion shares; issued and outstanding 1,105 million shares as of December 31, 2012
and 1,164 million shares as of December 31, 2011 221 232
Additional paid-in capital 12,067 12,217
Retained earnings 7,525 7,221
Accumulated other comprehensive (loss) income
Net unrealized securities gains, net of tax of: 2012, $175; 2011, $168 315 288
Net unrealized derivatives losses, net of tax of: 2012, $—; 2011, $(1) —(1)
Foreign currency translation adjustments, net of tax of: 2012, $(611); 2011, $(459) (754) (682)
Net unrealized pension and other postretirement benefit losses, net of tax of: 2012, $(233); 2011, $(233) (488) (481)
Total accumulated other comprehensive loss (927) (876)
Total shareholders’ equity 18,886 18,794
Total liabilities and shareholders’ equity $ 153,140 $ 153,337
See Notes to Consolidated Financial Statements.
62