Apple 2010 Annual Report Download - page 28
Download and view the complete annual report
Please find page 28 of the 2010 Apple annual report below. You can navigate through the pages in the report by either clicking on the pages listed below, or by using the keyword search tool below to find specific information within the annual report.-
 1
1 -
2
-
3
-
4
-
5
-
6
-
7
-
8
-
9
-
10
-
11
-
12
-
13
-
14
-
15
-
16
-
17
-
 18
18 -
 19
19 -
 20
20 -
 21
21 -
 22
22 -
 23
23 -
 24
24 -
 25
25 -
 26
26 -
 27
27 -
 28
28 -
 29
29 -
 30
30 -
 31
31 -
 32
32 -
 33
33 -
 34
34 -
 35
35 -
 36
36 -
 37
37 -
 38
38 -
39
-
40
-
41
-
42
-
43
-
44
-
45
-
46
-
47
-
48
-
49
-
50
-
51
-
52
-
53
-
54
-
55
-
56
-
57
-
58
-
59
-
60
-
61
-
62
-
63
-
64
-
65
-
66
-
67
-
68
-
69
-
70
-
71
-
72
-
73
-
74
-
75
-
76
-
77
-
78
-
79
-
80
-
81
-
82
-
83
-
84
-
85
-
86
-
87
-
88
-
89
-
90
-
91
-
92
-
93
-
94
-
95
-
96
-
97
-
98
-
99
-
100
-
101
-
102
-
103
-
104
-
105
-
106
-
107
-
108
-
109
-
110
-
111
-
112
-
113
-
114
-
115
-
116
-
117
-
118
 |
 |

Table of Contents
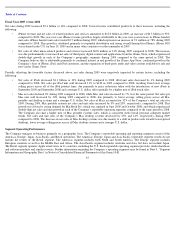
Company Stock Performance
The following graph shows a five-
year comparison of cumulative total shareholder return, calculated on a dividend reinvested basis, for the
Company, the S&P 500 Composite Index, the S&P Computer Hardware Index, and the Dow Jones U.S. Technology Index. The Company has
added the Dow Jones U.S. Technology Index to the graph to capture the stock performance of companies whose products and services more
closely relate to those of the Company. The Dow Jones U.S. Technology Index incorporates software and computer services companies, as well
as technology hardware and equipment companies. The graph assumes $100 was invested in each of the Company’
s common stock, the S&P
500 Composite Index, the S&P Computer Hardware Index, and the Dow Jones U.S. Technology Index on September 30, 2005. Data points on
the graph are annual. Note that historic stock price performance is not necessarily indicative of future stock price performance.
*$100 invested on 9/30/05 in stock or index, including reinvestment of dividends.
Copyright 2010 S&P, a division of The McGraw -Hill Companies Inc. All rights reserved.
Copyright 2010 Dow Jones & Co. All rights reserved.
25
September 30,
2005
September 30,
2006
September 30,
2007
September 30,
2008
September 30,
2009
September 30,
2010
Apple Inc.
$
100
$
144
$
286
$
212
$
346
$
529
S&P 500
$
100
$
111
$
129
$
101
$
94
$
103
S&P Computer Hardware
$
100
$
107
$
158
$
132
$
157
$
186
Dow Jones US
Technology
$
100
$
106
$
131
$
100
$
111
$
124
©
©