Apple 2010 Annual Report Download - page 62
Download and view the complete annual report
Please find page 62 of the 2010 Apple annual report below. You can navigate through the pages in the report by either clicking on the pages listed below, or by using the keyword search tool below to find specific information within the annual report.-
 1
1 -
2
-
3
-
4
-
5
-
6
-
7
-
8
-
9
-
10
-
11
-
12
-
13
-
14
-
15
-
16
-
17
-
18
-
19
-
20
-
21
-
22
-
23
-
24
-
25
-
26
-
27
-
28
-
29
-
30
-
31
-
32
-
33
-
34
-
35
-
36
-
37
-
38
-
39
-
40
-
41
-
42
-
43
-
44
-
45
-
46
-
47
-
48
-
49
-
50
-
51
-
 52
52 -
 53
53 -
 54
54 -
 55
55 -
 56
56 -
 57
57 -
 58
58 -
 59
59 -
 60
60 -
 61
61 -
 62
62 -
 63
63 -
 64
64 -
 65
65 -
 66
66 -
 67
67 -
 68
68 -
 69
69 -
 70
70 -
 71
71 -
 72
72 -
73
-
74
-
75
-
76
-
77
-
78
-
79
-
80
-
81
-
82
-
83
-
84
-
85
-
86
-
87
-
88
-
89
-
90
-
91
-
92
-
93
-
94
-
95
-
96
-
97
-
98
-
99
-
100
-
101
-
102
-
103
-
104
-
105
-
106
-
107
-
108
-
109
-
110
-
111
-
112
-
113
-
114
-
115
-
116
-
117
-
118
 |
 |

Table of Contents
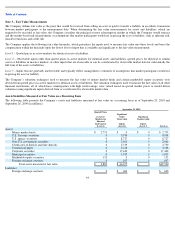
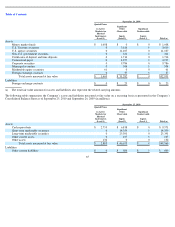
The following tables summarize the Company’s available-for-sale securities’
adjusted cost, gross unrealized gains, gross unrealized losses and
fair value by significant investment category as of September 25, 2010 and September 26, 2009 (in millions):
The Company had net unrealized gains on its investment portfolio of $180 million and $57 million as of September 25, 2010 and September 26,
2009, respectively. The net unrealized gains as of September 25, 2010 and September 26, 2009 related primarily to long-
term marketable
securities. The Company may sell certain of its marketable securities prior to their stated maturities for strategic purposes, in anticipation of
credit deterioration, or for duration management. The Company recognized no significant net realized gains or losses during 2010, 2009 and
2008 related to such sales. The maturities of the Company’s long-term marketable securities generally range from one year to five years .
59
September 25, 2010
Adjusted
Cost
Unrealized
Gains
Unrealized
Losses
Fair
Value
Money market funds
$
2,753
$
0
$
0
$
2,753
U.S. Treasury securities
9,872
42
0
9,914
U.S. agency securities
8,717
10
0
8,727
Non
-
U.S. government securities
2,648
13
0
2,661
Certificates of deposit and time deposits
2,735
5
(1
)
2,739
Commercial paper
3,168
0
0
3,168
Corporate securities
17,349
102
(9
)
17,442
Municipal securities
1,899
19
(1
)
1,917
Total cash equivalents and marketable securities
$
49,141
$
191
$
(11
)
$
49,321
September 26, 2009
Adjusted
Cost
Unrealized
Gains
Unrealized
Losses
Fair
Value
Money market funds
$
1,608
$
0
$
0
$
1,608
U.S. Treasury securities
3,610
6
0
3,616
U.S. agency securities
11,085
22
0
11,107
Non
-
U.S. government securities
320
1
0
321
Certificates of deposit and time deposits
1,714
0
0
1,714
Commercial paper
4,197
0
0
4,197
Corporate securities
9,760
42
(16
)
9,786
Municipal securities
502
2
0
504
Total cash equivalents and marketable securities
$
32,796
$
73
$
(16
)
$
32,853