Apple 2010 Annual Report Download - page 85
Download and view the complete annual report
Please find page 85 of the 2010 Apple annual report below. You can navigate through the pages in the report by either clicking on the pages listed below, or by using the keyword search tool below to find specific information within the annual report.-
 1
1 -
2
-
3
-
4
-
5
-
6
-
7
-
8
-
9
-
10
-
11
-
12
-
13
-
14
-
15
-
16
-
17
-
18
-
19
-
20
-
21
-
22
-
23
-
24
-
25
-
26
-
27
-
28
-
29
-
30
-
31
-
32
-
33
-
34
-
35
-
36
-
37
-
38
-
39
-
40
-
41
-
42
-
43
-
44
-
45
-
46
-
47
-
48
-
49
-
50
-
51
-
52
-
53
-
54
-
55
-
56
-
57
-
58
-
59
-
60
-
61
-
62
-
63
-
64
-
65
-
66
-
67
-
68
-
69
-
70
-
71
-
72
-
73
-
74
-
 75
75 -
 76
76 -
 77
77 -
 78
78 -
 79
79 -
 80
80 -
 81
81 -
 82
82 -
 83
83 -
 84
84 -
 85
85 -
 86
86 -
 87
87 -
 88
88 -
 89
89 -
 90
90 -
 91
91 -
 92
92 -
 93
93 -
 94
94 -
 95
95 -
96
-
97
-
98
-
99
-
100
-
101
-
102
-
103
-
104
-
105
-
106
-
107
-
108
-
109
-
110
-
111
-
112
-
113
-
114
-
115
-
116
-
117
-
118
 |
 |

Table of Contents
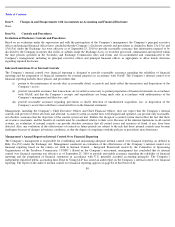
Agreement during 2010, 2009 and 2008, respectively. All expenses recognized pursuant to the Reimbursement Agreement have been included in
selling, general and administrative expenses in the Consolidated Statements of Operations.
Note 11 – Selected Quarterly Financial Information (Unaudited)
The following tables set forth a summary of the Company’
s quarterly financial information for each of the four quarters ended September 25,
2010 and September 26, 2009 (in millions, except per share amounts):
Basic and diluted earnings per share are computed independently for each of the quarters presented. Therefore, the sum of quarterly basic and
diluted per share information may not equal annual basic and diluted earnings per share.
82
Fourth Quarter
Third Quarter
Second Quarter
First Quarter
2010
Net sales
$
20,343
$
15,700
$
13,499
$
15,683
Gross margin
$
7,512
$
6,136
$
5,625
$
6,411
Net income
$
4,308
$
3,253
$
3,074
$
3,378
Earnings per common share:
Basic
$
4.71
$
3.57
$
3.39
$
3.74
Diluted
$
4.64
$
3.51
$
3.33
$
3.67
2009
Net sales
$
12,207
$
9,734
$
9,084
$
11,880
Gross margin
$
5,105
$
3,983
$
3,627
$
4,507
Net income
$
2,532
$
1,828
$
1,620
$
2,255
Earnings per common share:
Basic
$
2.82
$
2.05
$
1.82
$
2.54
Diluted
$
2.77
$
2.01
$
1.79
$
2.50