Apple 2010 Annual Report Download - page 78
Download and view the complete annual report
Please find page 78 of the 2010 Apple annual report below. You can navigate through the pages in the report by either clicking on the pages listed below, or by using the keyword search tool below to find specific information within the annual report.-
 1
1 -
2
-
3
-
4
-
5
-
6
-
7
-
8
-
9
-
10
-
11
-
12
-
13
-
14
-
15
-
16
-
17
-
18
-
19
-
20
-
21
-
22
-
23
-
24
-
25
-
26
-
27
-
28
-
29
-
30
-
31
-
32
-
33
-
34
-
35
-
36
-
37
-
38
-
39
-
40
-
41
-
42
-
43
-
44
-
45
-
46
-
47
-
48
-
49
-
50
-
51
-
52
-
53
-
54
-
55
-
56
-
57
-
58
-
59
-
60
-
61
-
62
-
63
-
64
-
65
-
66
-
67
-
 68
68 -
 69
69 -
 70
70 -
 71
71 -
 72
72 -
 73
73 -
 74
74 -
 75
75 -
 76
76 -
 77
77 -
 78
78 -
 79
79 -
 80
80 -
 81
81 -
 82
82 -
 83
83 -
 84
84 -
 85
85 -
 86
86 -
 87
87 -
 88
88 -
89
-
90
-
91
-
92
-
93
-
94
-
95
-
96
-
97
-
98
-
99
-
100
-
101
-
102
-
103
-
104
-
105
-
106
-
107
-
108
-
109
-
110
-
111
-
112
-
113
-
114
-
115
-
116
-
117
-
118
 |
 |

Table of Contents
Stock-Based Compensation
Stock-based compensation cost for RSUs is measured based on the closing fair market value of the Company’
s common stock on the date of
grant. Stock-based compensation cost for stock options and employee stock purchase plan rights (“stock purchase rights”)
is estimated at the
grant date and offering date, respectively, based on the fair-value as calculated by the BSM option-pricing model. The BSM option-
pricing
model incorporates various assumptions including expected volatility, expected life and interest rates. The expected volatility is based on the
historical volatility of the Company’
s common stock over the most recent period commensurate with the estimated expected life of the
Company’s stock options and other relevant factors including implied volatility in market traded options on the Company’
s common stock. The
Company bases its expected life assumption on its historical experience and on the terms and conditions of the stock awards it grants to
employees. The Company recognizes stock-based compensation cost as expense ratably on a straight-line basis over the requisite service period.
The weighted-
average assumptions used for stock options granted do not apply to employee stock options assumed in conjunction with business
acquisitions during the year ended September 25, 2010. The weighted-
average fair value of stock options assumed during the year ended
September 25, 2010 was $216.82. There were no stock options assumed during 2009 and 2008. The weighted-
average assumptions used for the
three years ended September 25, 2010, and the resulting estimates of weighted-
average fair value per share of options granted and of stock
purchase rights during those periods are as follows:
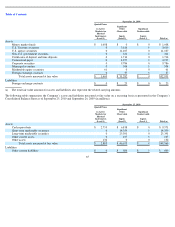
The following table provides a summary of the stock-
based compensation expense included in the Consolidated Statements of Operations for the
three years ended September 25, 2010 (in millions):
Stock-
based compensation expense capitalized as software development costs was not significant as of September 25, 2010 or September 26,
2009. The income tax benefit related to stock-
based compensation expense was $314 million, $266 million and $169 million for 2010, 2009 and
2008, respectively. The total unrecognized compensation cost related to stock options and RSUs expected to vest was $1.9 billion as of
September 25, 2010, which is expected to be recognized over a weighted-average period of 2.73 years.
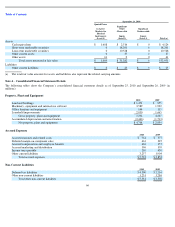
Note 8 – Commitments and Contingencies
Lease Commitments
The Company leases various equipment and facilities, including retail space, under noncancelable operating lease arrangements. The Company
does not currently utilize any other off-balance sheet financing arrangements. The
75
2010
2009
2008
Expected life of stock options
10 years
4.54 years
3.41 years
Expected life of stock purchase rights
6 months
6 months
6 months
Interest rate
-
stock options
3.71%
2.04%
3.40%
Interest rate
-
stock purchase rights
0.25%
0.58%
3.48%
Volatility
-
stock options
36.30%
50.98%
45.64%
Volatility
-
stock purchase rights
33.28%
52.16%
38.51%
Dividend yields
0
0
0
Weighted
-
average fair value of stock options granted during the year
$
108.58
$
46.71
$
62.73
Weighted
-
average fair value of stock purchase plan rights during the year
$
45.03
$
30.62
$
42.27
2010
2009
2008
Cost of sales
$
151
$
114
$
80
Research and development
323
258
185
Selling, general and administrative
405
338
251
Total stock
-
based compensation expense
$
879
$
710
$
516