Apple 2010 Annual Report Download - page 69
Download and view the complete annual report
Please find page 69 of the 2010 Apple annual report below. You can navigate through the pages in the report by either clicking on the pages listed below, or by using the keyword search tool below to find specific information within the annual report.-
 1
1 -
2
-
3
-
4
-
5
-
6
-
7
-
8
-
9
-
10
-
11
-
12
-
13
-
14
-
15
-
16
-
17
-
18
-
19
-
20
-
21
-
22
-
23
-
24
-
25
-
26
-
27
-
28
-
29
-
30
-
31
-
32
-
33
-
34
-
35
-
36
-
37
-
38
-
39
-
40
-
41
-
42
-
43
-
44
-
45
-
46
-
47
-
48
-
49
-
50
-
51
-
52
-
53
-
54
-
55
-
56
-
57
-
58
-
 59
59 -
 60
60 -
 61
61 -
 62
62 -
 63
63 -
 64
64 -
 65
65 -
 66
66 -
 67
67 -
 68
68 -
 69
69 -
 70
70 -
 71
71 -
 72
72 -
 73
73 -
 74
74 -
 75
75 -
 76
76 -
 77
77 -
 78
78 -
 79
79 -
80
-
81
-
82
-
83
-
84
-
85
-
86
-
87
-
88
-
89
-
90
-
91
-
92
-
93
-
94
-
95
-
96
-
97
-
98
-
99
-
100
-
101
-
102
-
103
-
104
-
105
-
106
-
107
-
108
-
109
-
110
-
111
-
112
-
113
-
114
-
115
-
116
-
117
-
118
 |
 |

Table of Contents
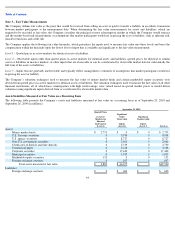
Note 4 – Consolidated Financial Statement Details
The following tables show the Company’
s consolidated financial statement details as of September 25, 2010 and September 26, 2009 (in
millions):
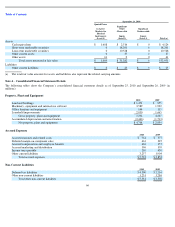
Property, Plant and Equipment
Accrued Expenses
Non-Current Liabilities
66
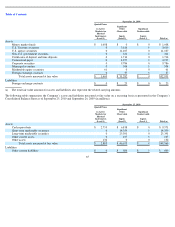
September 26, 2009
Quoted Prices
in Active
Markets for
Identical
Instruments
(Level 1)
Significant
Other
Observable
Inputs
(Level 2)
Significant
Unobservable
Inputs
(Level 3)
Total (a)
Assets:
Cash equivalents
$
1,608
$
2,516
$
0
$
4,124
Short
-
term marketable securities
0
18,201
0
18,201
Long
-
term marketable securities
0
10,528
0
10,528
Other current assets
0
37
0
37
Other assets
61
0
0
61
Total assets measured at fair value
$
1,669
$
31,282
$
0
$
32,951
Liabilities:
Other current liabilities
$
0
$
25
$
0
$
25
(a)
The total fair value amounts for assets and liabilities also represent the related carrying amounts.
2010
2009
Land and buildings
$
1,471
$
955
Machinery, equipment and internal
-
use software
3,589
1,932
Office furniture and equipment
144
115
Leasehold improvements
2,030
1,665
Gross property, plant and equipment
7,234
4,667
Accumulated depreciation and amortization
(2,466
)
(1,713
)
Net property, plant and equipment
$
4,768
$
2,954
2010
2009
Accrued warranty and related costs
$
761
$
577
Deferred margin on component sales
663
225
Accrued compensation and employee benefits
436
357
Accrued marketing and distribution
396
359
Income taxes payable
210
430
Other current liabilities
3,257
1,904
Total accrued expenses
$
5,723
$
3,852
2010
2009
Deferred tax liabilities
$
4,300
$
2,216
Other non
-
current liabilities
1,231
1,286
Total other non
-
current liabilities
$
5,531
$
3,502