Apple 2010 Annual Report Download - page 77
Download and view the complete annual report
Please find page 77 of the 2010 Apple annual report below. You can navigate through the pages in the report by either clicking on the pages listed below, or by using the keyword search tool below to find specific information within the annual report.-
 1
1 -
2
-
3
-
4
-
5
-
6
-
7
-
8
-
9
-
10
-
11
-
12
-
13
-
14
-
15
-
16
-
17
-
18
-
19
-
20
-
21
-
22
-
23
-
24
-
25
-
26
-
27
-
28
-
29
-
30
-
31
-
32
-
33
-
34
-
35
-
36
-
37
-
38
-
39
-
40
-
41
-
42
-
43
-
44
-
45
-
46
-
47
-
48
-
49
-
50
-
51
-
52
-
53
-
54
-
55
-
56
-
57
-
58
-
59
-
60
-
61
-
62
-
63
-
64
-
65
-
66
-
 67
67 -
 68
68 -
 69
69 -
 70
70 -
 71
71 -
 72
72 -
 73
73 -
 74
74 -
 75
75 -
 76
76 -
 77
77 -
 78
78 -
 79
79 -
 80
80 -
 81
81 -
 82
82 -
 83
83 -
 84
84 -
 85
85 -
 86
86 -
 87
87 -
88
-
89
-
90
-
91
-
92
-
93
-
94
-
95
-
96
-
97
-
98
-
99
-
100
-
101
-
102
-
103
-
104
-
105
-
106
-
107
-
108
-
109
-
110
-
111
-
112
-
113
-
114
-
115
-
116
-
117
-
118
 |
 |

Table of Contents
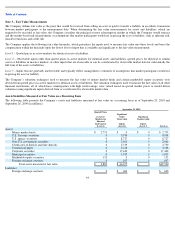
Stock Option Activity
A summary of the Company’
s stock option and RSU activity and related information for the three years ended September 25, 2010, is as follows
(in thousands, except per share amounts and contractual term in years):
Aggregate intrinsic value represents the value of the Company’
s closing stock price on the last trading day of the fiscal period in excess of the
weighted-
average exercise price multiplied by the number of options outstanding or exercisable. The aggregate intrinsic value excludes the effect
of stock options that have a zero or negative intrinsic value. Total intrinsic value of options at time of exercise was $2.0 billion, $827 million and
$2.0 billion for 2010, 2009 and 2008, respectively.
RSUs granted are deducted from the shares available for grant under the Company’
s stock option plans utilizing a factor of two times the number
of RSUs granted. Similarly, RSUs cancelled are added back to the shares available for grant under the Company’
s stock option plans utilizing a
factor of two times the number of RSUs cancelled. Outstanding RSU balances are not included in the outstanding options balances in the stock
option activity table.
74
Outstanding Options
Shares
Available
for Grant
Number
of Shares
Weighted
-
Average
Exercise
Price
Weighted-
Average
Remaining
Contractual
Term
Aggregate
Intrinsic
Value
Balance at September 29, 2007
67,827
49,751
$
43.91
Restricted stock units granted
(9,834
)
0
$
0
Options granted
(9,359
)
9,359
$
171.36
Options cancelled
1,236
(1,236
)
$
98.40
Restricted stock units cancelled
714
0
$
0
Options exercised
0
(13,728
)
$
27.88
Plan shares expired
(12
)
0
$
0
Balance at September 27, 2008
50,572
44,146
$
74.39
Restricted stock units granted
(15,572
)
0
$
0
Options granted
(234
)
234
$
106.84
Options cancelled
1,241
(1,241
)
$
122.98
Restricted stock units cancelled
1,256
0
$
0
Options exercised
0
(8,764
)
$
41.78
Plan shares expired
(2
)
0
$
0
Balance at September 26, 2009
37,261
34,375
$
81.17
Additional shares authorized
36,000
0
$
0
Restricted stock units granted
(12,356
)
0
$
0
Options granted
(34
)
34
$
202.00
Options assumed
0
98
$
11.99
Options cancelled
430
(430
)
$
136.27
Restricted stock units cancelled
1,444
0
$
0
Options exercised
0
(12,352
)
$
62.69
Plan shares expired
(8
)
0
$
0
Balance at September 25, 2010
62,737
21,725
$
90.46
2.85
$
4,385,291
Exercisable at September 25, 2010
17,791
$
77.74
2.57
$
3,817,663
Expected to vest after September 25, 2010
3,880
$
148.03
4.12
$
559,882