Apple 2010 Annual Report Download - page 76
Download and view the complete annual report
Please find page 76 of the 2010 Apple annual report below. You can navigate through the pages in the report by either clicking on the pages listed below, or by using the keyword search tool below to find specific information within the annual report.-
 1
1 -
2
-
3
-
4
-
5
-
6
-
7
-
8
-
9
-
10
-
11
-
12
-
13
-
14
-
15
-
16
-
17
-
18
-
19
-
20
-
21
-
22
-
23
-
24
-
25
-
26
-
27
-
28
-
29
-
30
-
31
-
32
-
33
-
34
-
35
-
36
-
37
-
38
-
39
-
40
-
41
-
42
-
43
-
44
-
45
-
46
-
47
-
48
-
49
-
50
-
51
-
52
-
53
-
54
-
55
-
56
-
57
-
58
-
59
-
60
-
61
-
62
-
63
-
64
-
65
-
 66
66 -
 67
67 -
 68
68 -
 69
69 -
 70
70 -
 71
71 -
 72
72 -
 73
73 -
 74
74 -
 75
75 -
 76
76 -
 77
77 -
 78
78 -
 79
79 -
 80
80 -
 81
81 -
 82
82 -
 83
83 -
 84
84 -
 85
85 -
 86
86 -
87
-
88
-
89
-
90
-
91
-
92
-
93
-
94
-
95
-
96
-
97
-
98
-
99
-
100
-
101
-
102
-
103
-
104
-
105
-
106
-
107
-
108
-
109
-
110
-
111
-
112
-
113
-
114
-
115
-
116
-
117
-
118
 |
 |

Table of Contents
Restricted Stock Units
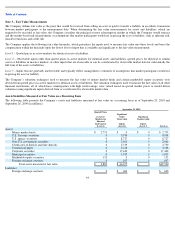
A summary of the Company’
s RSU activity and related information for the three years ended September 25, 2010, is as follows (in thousands,
except per share amounts):
The fair value as of the vesting date of RSUs was $1 billion, $221 million and $320 million for 2010, 2009 and 2008, respectively. Upon vesting,
the RSUs are generally net share-
settled to cover the required withholding tax and the remaining amount is converted into an equivalent number
of shares of common stock. The majority of RSUs that vested in 2010, 2009 and 2008, were net-
share settled such that the Company withheld
shares with value equivalent to the employees’
minimum statutory obligation for the applicable income and other employment taxes, and
remitted the cash to the appropriate taxing authorities. The total shares withheld were approximately 1.8 million, 707,000 and 857,000 for 2010,
2009 and 2008, respectively, and were based on the value of the RSUs on their vesting date as determined by the Company’
s closing stock price.
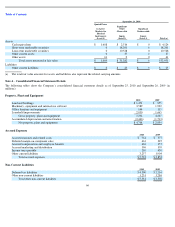
Total payments for the employees’
tax obligations to the taxing authorities were $406 million, $82 million and $124 million in 2010, 2009 and
2008, respectively, and are reflected as a financing activity within the Consolidated Statements of Cash Flows. These net-
share settlements had
the effect of share repurchases by the Company as they reduced and retired the number of shares that would have otherwise been issued as a
result of the vesting and did not represent an expense to the Company.
73
Number of
Shares
Weighted
-
Average
Grant
Date Fair
Value
Aggregate
Intrinsic Value
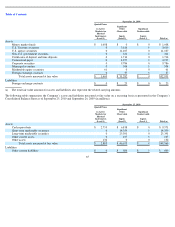
Balance at September 29, 2007
4,675
$
52.98
Restricted stock units granted
4,917
$
162.61
Restricted stock units vested
(2,195
)
$
25.63
Restricted stock units cancelled
(357
)
$
119.12
Balance at September 27, 2008
7,040
$
134.91
Restricted stock units granted
7,786
$
111.80
Restricted stock units vested
(1,935
)
$
124.87
Restricted stock units cancelled
(628
)
$
121.28
Balance at September 26, 2009
12,263
$
122.52
Restricted stock units granted
6,178
$
214.37
Restricted stock units vested
(4,685
)
$
119.85
Restricted stock units cancelled
(722
)
$
147.56
Balance at September 25, 2010
13,034
$
165.63
$
3,810,287