Apple 2010 Annual Report Download - page 66
Download and view the complete annual report
Please find page 66 of the 2010 Apple annual report below. You can navigate through the pages in the report by either clicking on the pages listed below, or by using the keyword search tool below to find specific information within the annual report.-
 1
1 -
2
-
3
-
4
-
5
-
6
-
7
-
8
-
9
-
10
-
11
-
12
-
13
-
14
-
15
-
16
-
17
-
18
-
19
-
20
-
21
-
22
-
23
-
24
-
25
-
26
-
27
-
28
-
29
-
30
-
31
-
32
-
33
-
34
-
35
-
36
-
37
-
38
-
39
-
40
-
41
-
42
-
43
-
44
-
45
-
46
-
47
-
48
-
49
-
50
-
51
-
52
-
53
-
54
-
55
-
 56
56 -
 57
57 -
 58
58 -
 59
59 -
 60
60 -
 61
61 -
 62
62 -
 63
63 -
 64
64 -
 65
65 -
 66
66 -
 67
67 -
 68
68 -
 69
69 -
 70
70 -
 71
71 -
 72
72 -
 73
73 -
 74
74 -
 75
75 -
 76
76 -
77
-
78
-
79
-
80
-
81
-
82
-
83
-
84
-
85
-
86
-
87
-
88
-
89
-
90
-
91
-
92
-
93
-
94
-
95
-
96
-
97
-
98
-
99
-
100
-
101
-
102
-
103
-
104
-
105
-
106
-
107
-
108
-
109
-
110
-
111
-
112
-
113
-
114
-
115
-
116
-
117
-
118
 |
 |

Table of Contents
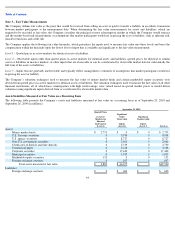
The following tables show the pre-tax effect of the Company’
s derivative instruments designated as cash flow and net investment hedges in the
Consolidated Statements of Operations for the years ended September 25, 2010 and September 26, 2009 (in millions):
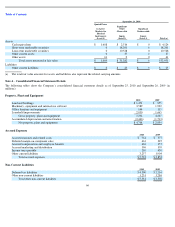
Accounts Receivable
Trade Receivables
The Company distributes its products through third-party cellular network carriers, wholesalers, retailers and value-
added resellers and directly
to certain education, consumer and enterprise customers. The Company generally does not require collateral from its customers; however, the
Company will require collateral in certain instances to limit credit risk. In addition, when possible, the Company attempts to limit credit risk on
trade receivables with credit insurance for certain customers in Latin America, Europe, Asia, and Australia, or by requiring third-
party financing,
loans or leases to support credit exposure. These credit-financing arrangements are directly between the third-
party financing company and the
end customer. As such, the Company generally does not assume any recourse or credit risk sharing related to any of these arrangements.
However, considerable trade receivables not covered by collateral, third-
party financing arrangements, or credit insurance are outstanding with
the Company’s third-party cellular network carriers, wholesalers, retailers and value-
added resellers. Trade receivables from two of the
Company’s customers accounted for 15% and 12% of trade receivables as of September 25, 2010 and one of the Company’
s customers
accounted for 16% of trade receivables as of September 26, 2009. The Company’
s cellular network carriers accounted for 64% and 51% of trade
receivables as of September 25, 2010 and as of September 26, 2009, respectively. The additions and write-offs to the Company’
s allowance for
doubtful accounts during 2010, 2009 and 2008 were not significant.
Vendor Non-Trade Receivables
The Company has non-
trade receivables from certain of its manufacturing vendors resulting from the sale of components to these manufacturing
vendors who manufacture sub-
assemblies or assemble final products for the Company. The Company purchases these components directly from
suppliers. Vendor non-trade receivables from two of the Company’s vendors accounted for 57% and 24%, respectively, of non-
trade receivables
as of September 25, 2010 and two of the Company’s vendors accounted for 40% and 36%, respectively, of non-
trade receivables as of
September 26, 2009. The Company does not reflect the sale of these components in net sales and does not recognize any profits on these sales
until the related products are sold by the Company, at which time any profit is recognized as a reduction of cost of sales.
63
Gains/(Losses)
Recognized
in OCI - Effective Portion (c)
Gains/(Losses)
Reclassified from AOCI into
Income - Effective Portion (c)
Gains/(Losses) Recognized – Ineffective
Portion and Amount Excluded from
Effectiveness Testing
September 25,
2010
September 26,
2009
September 25,
2010 (a)
September 26,
2009 (b)
Location
September 25,
2010
September 26,
2009
Cash flow hedges:
Foreign exchange
contracts
$
(267
)
$
338
$
115
$
370
Other income
and expense
$
(175
)
$
(97
)
Net investment hedges:
Foreign exchange
contracts
(41
)
(44
)
0
0
Other income
and expense
1
3
Total
$
(308
)
$
294
$
115
$
370
$
(174
)
$
(94
)
(a)
Includes gains/(losses) reclassified from AOCI into net income for the effective portion of cash flow hedges, of which $158 million and
($43) million were recognized within net sales and cost of sales, respectively, within the Statement of Operations for the year ended
September 25, 2010. There were no amounts reclassified from AOCI into net income for the effective portion of net investment hedges for
the year ended September 25, 2010.
(b)
Includes gains/(losses) reclassified from AOCI into net income for the effective portion of cash flow hedges, of which $302 million and
$68 million were recognized within net sales and cost of sales, respectively, within the Statement of Operations for the year ended
September 26, 2009. There were no amounts reclassified from AOCI into net income for the effective portion of net investment hedges for
the year ended September 26, 2009.
(c)
Refer to Note 7,
“
Shareholders
’
Equity and Stock
-
Based Compensation
”
of this Form 10
-
K, which summarizes the activity in accumulated
other comprehensive income related to derivatives.