Apple 2010 Annual Report Download - page 74
Download and view the complete annual report
Please find page 74 of the 2010 Apple annual report below. You can navigate through the pages in the report by either clicking on the pages listed below, or by using the keyword search tool below to find specific information within the annual report.-
 1
1 -
2
-
3
-
4
-
5
-
6
-
7
-
8
-
9
-
10
-
11
-
12
-
13
-
14
-
15
-
16
-
17
-
18
-
19
-
20
-
21
-
22
-
23
-
24
-
25
-
26
-
27
-
28
-
29
-
30
-
31
-
32
-
33
-
34
-
35
-
36
-
37
-
38
-
39
-
40
-
41
-
42
-
43
-
44
-
45
-
46
-
47
-
48
-
49
-
50
-
51
-
52
-
53
-
54
-
55
-
56
-
57
-
58
-
59
-
60
-
61
-
62
-
63
-
 64
64 -
 65
65 -
 66
66 -
 67
67 -
 68
68 -
 69
69 -
 70
70 -
 71
71 -
 72
72 -
 73
73 -
 74
74 -
 75
75 -
 76
76 -
 77
77 -
 78
78 -
 79
79 -
 80
80 -
 81
81 -
 82
82 -
 83
83 -
 84
84 -
85
-
86
-
87
-
88
-
89
-
90
-
91
-
92
-
93
-
94
-
95
-
96
-
97
-
98
-
99
-
100
-
101
-
102
-
103
-
104
-
105
-
106
-
107
-
108
-
109
-
110
-
111
-
112
-
113
-
114
-
115
-
116
-
117
-
118
 |
 |

Table of Contents
of foreign currency translation adjustments from those subsidiaries not using the U.S. dollar as their functional currency, unrealized gains and
losses on marketable securities categorized as available-for-
sale, and net deferred gains and losses on certain derivative instruments accounted
for as cash flow hedges.
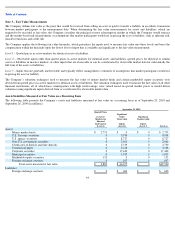
The following table summarizes the components of AOCI, net of taxes, as of the three years ended September 25, 2010 (in millions):
The change in fair value of available-for-
sale securities included in other comprehensive income was $123 million, $118 million and $(63)
million, net of taxes in 2010, 2009 and 2008, respectively. The tax effect related to the change in unrealized gains/losses on available-for-
sale
securities was $(72) million, $(78) million and $42 million for 2010, 2009 and 2008, respectively.
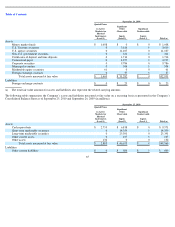
The following table summarizes activity in other comprehensive income related to derivatives, net of taxes, held by the Company during the
three years ended September 25, 2010 (in millions):
The tax effect related to the changes in fair value of derivatives was $97 million, $(135) million and $(5) million for 2010, 2009 and 2008,
respectively. The tax effect related to derivative gains/losses reclassified from other comprehensive income to net income was $43 million, $149
million and $(9) million for 2010, 2009 and 2008, respectively.
Employee Benefit Plans
2003 Employee Stock Plan
The 2003 Employee Stock Plan (the “2003 Plan”) is a shareholder approved plan that provides for broad-
based equity grants to employees,
including executive officers. The 2003 Plan permits the granting of incentive stock options, nonstatutory stock options, RSUs, stock appreciation
rights, stock purchase rights and performance-
based awards. Options granted under the 2003 Plan generally expire seven to ten years after the
grant date and generally become exercisable over a period of four years, based on continued employment, with either annual, semi-
annual or
quarterly vesting. In general, RSUs granted under the 2003 Plan vest over two to four years, are subject to the employees’
continued employment
and are paid upon vesting in shares of the Company’s common stock on a one-for-one basis. At the Company’
s 2010 annual meeting of
shareholders, the 2003 Plan was amended to (i) increase the number of shares of the Company’
s common stock that may be delivered pursuant
to awards granted under the 2003 Plan by an additional 36,000,000 shares and (ii) extend the Company’
s authority to grant awards under the
2003 Plan intended to qualify as “performance-based awards”
within the meaning of Section 162(m) of the U.S. Internal Revenue Code through
the 2015 annual meeting of shareholders. As of September 25, 2010, approximately 62.5 million shares were reserved for future issuance under
the 2003 Plan.
71
2010
2009
2008
Net unrealized gains/losses on marketable securities
$
171
$
48
$
(70
)
Net unrecognized gains/losses on derivative instruments
(252
)
1
19
Cumulative foreign currency translation
35
28
42
Accumulated other comprehensive income/(loss)
$
(46
)
$
77
$
(9
)
2010
2009
2008
Changes in fair value of derivatives
$
(180
)
$
204
$
7
Adjustment for net gains/losses realized and included in net income
(73
)
(222
)
12
Change in unrecognized gains/losses on derivative instruments
$
(253
)
$
(18
)
$
19