Charter 2006 Annual Report Download - page 10
Download and view the complete annual report
Please find page 10 of the 2006 Charter annual report below. You can navigate through the pages in the report by either clicking on the pages listed below, or by using the keyword search tool below to find specific information within the annual report.-
 1
1 -
 2
2 -
 3
3 -
 4
4 -
 5
5 -
 6
6 -
 7
7 -
 8
8 -
 9
9 -
 10
10 -
 11
11 -
 12
12 -
 13
13 -
 14
14 -
 15
15 -
 16
16 -
 17
17 -
 18
18 -
 19
19 -
 20
20 -
 21
21 -
22
-
23
-
24
-
25
-
26
-
27
-
28
-
29
-
30
-
31
-
32
-
33
-
34
-
35
-
36
-
37
-
38
-
39
-
40
-
41
-
42
-
43
-
44
-
45
-
46
-
47
-
48
-
49
-
50
-
51
-
52
-
53
-
54
-
55
-
56
-
57
-
58
-
59
-
60
-
61
-
62
-
63
-
64
-
65
-
66
-
67
-
68
-
69
-
70
-
71
-
72
-
73
-
74
-
75
-
76
-
77
-
78
-
79
-
80
-
81
-
82
-
83
-
84
-
85
-
86
-
87
-
88
-
89
-
90
-
91
-
92
-
93
-
94
-
95
-
96
-
97
-
98
-
99
-
100
-
101
-
102
-
103
-
104
-
105
-
106
-
107
-
108
-
109
-
110
-
111
-
112
-
113
-
114
-
115
-
116
-
117
-
118
-
119
-
120
-
121
-
122
-
123
-
124
 |
 |

8
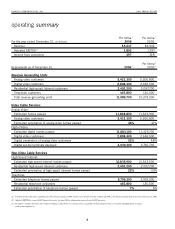
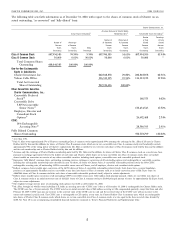
operating summary
Pro forma (1) Pro forma (1)
For the year ended December 31, (in millions) 2006 2005
Revenue $5,437 $4,942
Adjusted EBITDA(2) 1,892 1,797
Income from operations 497 328
Pro forma (1)
Approximate as of December 31, 2006(3) 2005(3)
Revenue Generating Units
Analog video customers 5,433,300 5,506,800
Digital video customers 2,808,400 2,638,500
Residential high-speed Internet customers 2,402,200 2,097,700
Telephone customers 445,800 136,000
Total revenue generating units 11,089,700 10,379,000
Video Cable Services
Analog Video:
Estimated homes passed 11,848,800 11,643,900
Analog video customers 5,433,300 5,506,800
Estimated penetration of analog video homes passed 46% 47%
Digital Video:
Estimated digital homes passed 11,683,100 11,429,700
Digital video customers 2,808,400 2,638,500
Digital penetration of analog video customers 52% 48%
Digital set-top terminals deployed 4,030,300 3,740,700
Non-Video Cable Services
High-Speed Internet:
Estimated high-speed Internet homes passed 10,835,900 10,543,500
Residential high-speed Internet customers 2,402,200 2,097,700
Estimated penetration of high-speed Internet homes passed 22% 20%
Telephone:
Estimated telephone homes passed 6,799,300 2,918,000
Residential telephone customers 445,800 136,000
Estimated penetration of telephone homes passed 7% 5%
(1) Pro forma results reflect the acquisition of cable systems in January 2006 and the sales of cable systems in 2005 and 2006 as if such transactions had occurred as of January 1, 2005.
(2) Adjusted EBITDA is a non-GAAP financial measure. See page 110 for information on use of non-GAAP measures.
(3) “Customers” include all persons our corporate billing records show as receiving service (regardless of their payment status), except for complimentary accounts
(such as our employees).
CHARTER COMMUNICATIONS, INC. 2006 ANNUAL REPORT