Charter 2006 Annual Report Download - page 52
Download and view the complete annual report
Please find page 52 of the 2006 Charter annual report below. You can navigate through the pages in the report by either clicking on the pages listed below, or by using the keyword search tool below to find specific information within the annual report.-
 1
1 -
2
-
3
-
4
-
5
-
6
-
7
-
8
-
9
-
10
-
11
-
12
-
13
-
14
-
15
-
16
-
17
-
18
-
19
-
20
-
21
-
22
-
23
-
24
-
25
-
26
-
27
-
28
-
29
-
30
-
31
-
32
-
33
-
34
-
35
-
36
-
37
-
38
-
39
-
40
-
41
-
 42
42 -
 43
43 -
 44
44 -
 45
45 -
 46
46 -
 47
47 -
 48
48 -
 49
49 -
 50
50 -
 51
51 -
 52
52 -
 53
53 -
 54
54 -
 55
55 -
 56
56 -
 57
57 -
 58
58 -
 59
59 -
 60
60 -
 61
61 -
 62
62 -
63
-
64
-
65
-
66
-
67
-
68
-
69
-
70
-
71
-
72
-
73
-
74
-
75
-
76
-
77
-
78
-
79
-
80
-
81
-
82
-
83
-
84
-
85
-
86
-
87
-
88
-
89
-
90
-
91
-
92
-
93
-
94
-
95
-
96
-
97
-
98
-
99
-
100
-
101
-
102
-
103
-
104
-
105
-
106
-
107
-
108
-
109
-
110
-
111
-
112
-
113
-
114
-
115
-
116
-
117
-
118
-
119
-
120
-
121
-
122
-
123
-
124
 |
 |

CHARTER COMMUNICATIONS, INC. 2006 FORM 10-K
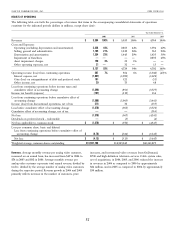
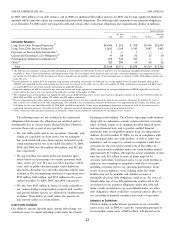
Revenues by service offering were as follows (dollars in millions):
Year Ended December 31,
2006 2005 2004 2006 over 2005 2005 over 2004
% of % of % of % %
Revenues Revenues Revenues Revenues Revenues Revenues Change Change Change Change
Video $3,349 61% $3,248 65% $3,217 68% $101 3% $31 1%
High-speed Internet 1,051 19% 875 17% 712 15% 176 20% 163 23%
Telephone 135 2% 36 1% 18 —99 275% 18 100%
Advertising sales 319 6% 284 6% 279 6% 35 12% 5 2%
Commercial 305 6% 266 5% 227 5% 39 15% 39 17%
Other 345 6% 324 6% 307 6% 21 6% 17 6%
$5,504 100% $5,033 100% $4,760 100% $471 9% $273 6%
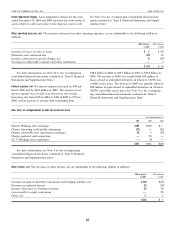
Video revenues consist primarily of revenues from analog and video customers increased by 127,800 and 124,600 customers in
digital video services provided to our non-commercial custom- 2006 and 2005, respectively. The increase in 2006 was reduced
ers. Analog video customers decreased by 210,700 and 79,100 by the sale, net of acquisitions, of 42,100 digital customers. The
customers in 2006 and 2005, respectively, of which 137,200 in increases in video revenues are attributable to the following
2006 was related to system sales, net of acquisitions. Digital (dollars in millions):
2006 compared 2005 compared
to 2005 to 2004
Increases related to price increases and incremental video services $ 102 $ 119
Increases related to increase in digital video customers 58 18
Decreases related to decrease in analog video customers (34) (76)
Increase related to acquisition 6—
Decreases related to system sales (31) (21)
Hurricane impact —(9)
$ 101 $31
High-speed Internet customers grew by 283,600 and 306,000 customers in 2006 and 2005, respectively, of which 20,900 in 2006 was
related to system sales, net of acquisitions. The increases in high-speed Internet revenues from our non-commercial customers are
attributable to the following (dollars in millions):
2006 compared 2005 compared
to 2005 to 2004
Increases related to increases in high-speed Internet customers $146 $135
Increases related to price increases 31 34
Increase related to acquisition 3—
Decreases related to system sales (4) (3)
Hurricane impact —(3)
$176 $163
Revenues from telephone services increased primarily as a In addition, the increases were offset by a decrease of $1 million
result of an increase of 324,300 telephone customers in 2006, of in 2006 and $1 million in 2005 as a result of system sales. For
which 14,500 was related to acquisitions, and 76,100 telephone the years ended December 31, 2006, 2005, and 2004, we
customers in 2005. Approximately $6 million of the increase in received $17 million, $15 million, and $16 million, respectively,
2006 telephone revenue compared to 2005 is related to an in advertising sales revenues from programmers.
acquisition. Commercial revenues consist primarily of revenues from
Advertising sales revenues consist primarily of revenues cable video and high-speed Internet services provided to our
from commercial advertising customers, programmers and other commercial customers. Commercial revenues increased primarily
vendors. In 2006, advertising sales revenues increased primarily as a result of an increase in commercial high-speed Internet
as a result of an increase in local and national advertising sales, revenues. The increases were reduced by approximately $1 mil-
including political advertising. In 2005, advertising sales revenues lion in 2006 and $3 million in 2005 as a result of system sales.
increased primarily as a result of an increase in local advertising Other revenues consist of revenues from franchise fees,
sales, and were offset by a decline in national advertising sales. equipment rental, customer installations, home shopping, dial-up
38