Charter 2006 Annual Report Download - page 118
Download and view the complete annual report
Please find page 118 of the 2006 Charter annual report below. You can navigate through the pages in the report by either clicking on the pages listed below, or by using the keyword search tool below to find specific information within the annual report.-
 1
1 -
2
-
3
-
4
-
5
-
6
-
7
-
8
-
9
-
10
-
11
-
12
-
13
-
14
-
15
-
16
-
17
-
18
-
19
-
20
-
21
-
22
-
23
-
24
-
25
-
26
-
27
-
28
-
29
-
30
-
31
-
32
-
33
-
34
-
35
-
36
-
37
-
38
-
39
-
40
-
41
-
42
-
43
-
44
-
45
-
46
-
47
-
48
-
49
-
50
-
51
-
52
-
53
-
54
-
55
-
56
-
57
-
58
-
59
-
60
-
61
-
62
-
63
-
64
-
65
-
66
-
67
-
68
-
69
-
70
-
71
-
72
-
73
-
74
-
75
-
76
-
77
-
78
-
79
-
80
-
81
-
82
-
83
-
84
-
85
-
86
-
87
-
88
-
89
-
90
-
91
-
92
-
93
-
94
-
95
-
96
-
97
-
98
-
99
-
100
-
101
-
102
-
103
-
104
-
105
-
106
-
107
-
 108
108 -
 109
109 -
 110
110 -
 111
111 -
 112
112 -
 113
113 -
 114
114 -
 115
115 -
 116
116 -
 117
117 -
 118
118 -
 119
119 -
 120
120 -
 121
121 -
 122
122 -
 123
123 -
 124
124
 |
 |

CHARTER COMMUNICATIONS, INC. AND SUBSIDIARIES 2006 FORM 10-K
Notes to Consolidated Financial Statements (continued)
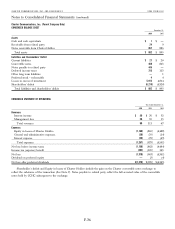
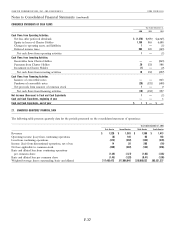
CONDENSED STATEMENTS OF CASH FLOWS
Year Ended December 31,
2006 2005 2004
Cash Flows from Operating Activities:
Net loss after preferred dividends $ (1,370) $(970) $(4,345)
Equity in losses of Charter Holdco 1,168 865 4,488
Changes in operating assets and liabilities 1— (1)
Deferred income taxes 202 105 (143)
Net cash flows from operating activities 1— (1)
Cash Flows from Investing Activities:
Receivables from Charter Holdco ——(863)
Payments from Charter Holdco 20 132 588
Investment in Charter Holdco (1) — (2)
Net cash flows from investing activities 19 132 (277)
Cash Flows from Financing Activities
Issuance of convertible notes —— 863
Paydown of convertible notes (20) (132) (588)
Net proceeds from issuance of common stock 1— 2
Net cash flows from financing activities (19) (132) 277
Net Increase (Decrease) in Cash and Cash Equivalents 1 — (1)
Cash and Cash Equivalents, beginning of year — — 1
Cash and Cash Equivalents, end of year $ 1 $—$—
27. UNAUDITED QUARTERLY FINANCIAL DATA
The following table presents quarterly data for the periods presented on the consolidated statement of operations:
Year Ended December 31, 2006
First Quarter Second Quarter Third Quarter Fourth Quarter
Revenues $ 1,320 $ 1,383 $ 1,388 $ 1,413
Operating income (loss) from continuing operations (8) 146 66 163
Loss from continuing operations (473) (402) (333) (378)
Income (loss) from discontinued operations, net of tax 14 20 200 (18)
Net loss applicable to common stock (459) (382) (133) (396)
Basic and diluted loss from continuing operations
per common share (1.49) (1.27) (1.02) (1.03)
Basic and diluted loss per common share (1.45) (1.20) (0.41) (1.08)
Weighted-average shares outstanding, basic and diluted 317,463,472 317,696,946 326,960,632 365,331,337
F-37