Charter 2006 Annual Report Download - page 60
Download and view the complete annual report
Please find page 60 of the 2006 Charter annual report below. You can navigate through the pages in the report by either clicking on the pages listed below, or by using the keyword search tool below to find specific information within the annual report.-
 1
1 -
2
-
3
-
4
-
5
-
6
-
7
-
8
-
9
-
10
-
11
-
12
-
13
-
14
-
15
-
16
-
17
-
18
-
19
-
20
-
21
-
22
-
23
-
24
-
25
-
26
-
27
-
28
-
29
-
30
-
31
-
32
-
33
-
34
-
35
-
36
-
37
-
38
-
39
-
40
-
41
-
42
-
43
-
44
-
45
-
46
-
47
-
48
-
49
-
 50
50 -
 51
51 -
 52
52 -
 53
53 -
 54
54 -
 55
55 -
 56
56 -
 57
57 -
 58
58 -
 59
59 -
 60
60 -
 61
61 -
 62
62 -
 63
63 -
 64
64 -
 65
65 -
 66
66 -
 67
67 -
 68
68 -
 69
69 -
 70
70 -
71
-
72
-
73
-
74
-
75
-
76
-
77
-
78
-
79
-
80
-
81
-
82
-
83
-
84
-
85
-
86
-
87
-
88
-
89
-
90
-
91
-
92
-
93
-
94
-
95
-
96
-
97
-
98
-
99
-
100
-
101
-
102
-
103
-
104
-
105
-
106
-
107
-
108
-
109
-
110
-
111
-
112
-
113
-
114
-
115
-
116
-
117
-
118
-
119
-
120
-
121
-
122
-
123
-
124
 |
 |

CHARTER COMMUNICATIONS, INC. 2006 FORM 10-K
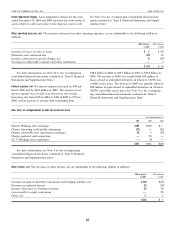
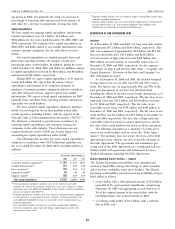
(d) Upgrade/rebuild includes costs to modify or replace existing fiber/coaxial cable
ing period in 2004, was primarily the result of a decrease in networks, including betterments.
borrowings of long-term debt and proceeds from issuance of (e) Support capital includes costs associated with the replacement or enhancement
debt offset by a decrease in repayments of long-term debt. of non-network assets (e.g., non-network equipment, land, buildings and
vehicles) due to technological and physical obsolescence.
Capital Expenditures
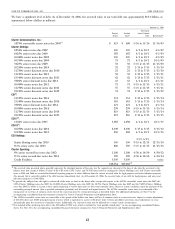
We have significant ongoing capital expenditure requirements. DESCRIPTION OF OUR OUTSTANDING DEBT
Capital expenditures were $1.1 billion, $1.1 billion, and
$924 million for the years ended December 31, 2006, 2005, and Overview
2004, respectively. The majority of the capital expenditures in As of December 31, 2006 and 2005, our long-term debt totaled
2006, 2005, and 2004 related to our scalable infrastructure and approximately $19.1 billion and $19.4 billion, respectively. This
customer premise equipment. See the table below for more debt was comprised of approximately $5.4 billion and $5.7 bil-
details. lion of credit facility debt, $13.3 billion and $12.8 billion
Our capital expenditures are funded primarily from cash accreted amount of high-yield notes and $408 million and
flows from operating activities, the issuance of debt and $863 million accreted amount of convertible senior notes at
borrowings under credit facilities. In addition, during the years December 31, 2006 and 2005, respectively. See the organiza-
ended December 31, 2006, 2005, and 2004, our liabilities related tional chart on page 4 and the first table under ‘‘— Liquidity and
to capital expenditures increased by $24 million, and $8 million, Capital Resources — Overview of Our Debt and Liquidity’’ for
and decreased $43 million, respectively. debt outstanding by issuer.
During 2007, we expect capital expenditures to be approxi- As of December 31, 2006 and 2005, the blended weighted
mately $1.2 billion. We expect that the nature of these average interest rate on our debt was 9.5% and 9.3%, respec-
expenditures will continue to be composed primarily of tively. The interest rate on approximately 78% and 77% of the
purchases of customer premise equipment related to telephone total principal amount of our debt was effectively fixed,
and other advanced services, support capital, and scalable including the effects of our interest rate hedge agreements, as of
infrastructure. We expect to fund capital expenditures for 2007 December 31, 2006 and 2005, respectively. The fair value of our
primarily from cash flows from operating activities and borrow- high-yield notes was $13.3 billion and $10.4 billion at Decem-
ings under our credit facilities. ber 31, 2006 and 2005, respectively. The fair value of our
We have adopted capital expenditure disclosure guidance, convertible senior notes was $576 million and $647 million at
which was developed by eleven then publicly traded cable December 31, 2006 and 2005, respectively. The fair value of our
system operators, including Charter, with the support of the credit facilities was $5.4 billion and $5.7 billion at December 31,
National Cable & Telecommunications Association (‘‘NCTA’’). 2006 and 2005, respectively. The fair value of high-yield and
The disclosure is intended to provide more consistency in convertible notes was based on quoted market prices, and the
reporting capital expenditures and customers among peer fair value of the credit facilities was based on dealer quotations.
companies in the cable industry. These disclosures are not The following description is a summary of certain provi-
required disclosures under GAAP, nor do they impact our sions of our credit facilities and our notes (the ‘‘Debt Agree-
accounting for capital expenditures under GAAP. ments’’). The summary does not restate the terms of the Debt
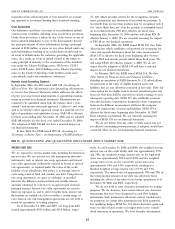
The following table presents our major capital expenditures Agreements in their entirety, nor does it describe all terms of
categories in accordance with NCTA disclosure guidelines for the Debt Agreements. The agreements and instruments gov-
the years ended December 31, 2006, 2005, and 2004 (dollars in erning each of the Debt Agreements are complicated and you
millions): should consult such agreements and instruments for more
detailed information regarding the Debt Agreements.
For the Years Ended December 31,
2006 2005 2004 Charter Operating Credit Facilities — General
The Charter Operating credit facilities were amended and
Customer premise equipment(a) $ 507 $ 434 $451
Scalable infrastructure(b) 214 174 108 restated in April 2006, among other things, to defer maturities
Line extensions(c) 107 134 131 and to increase availability under these facilities. The Charter
Upgrade/Rebuild(d) 45 49 49 Operating credit facilities provide borrowing availability of up to
Support capital(e) 230 297 185 $6.85 billion as follows:
Total capital expenditures $1,103 $1,088 $924 (a term facility with a total principal amount of $5.0 billion,
(a) Customer premise equipment includes costs for set-top boxes and cable repayable in 23 equal quarterly installments, commencing
modems, etc. used at the customer residence to secure new customers, revenue September 30, 2007 and aggregating in each loan year to
generating units, and additional bandwidth. It also includes customer installation
costs in accordance with SFAS 51. 1% of the original amount of the term facility, with the
(b) Scalable infrastructure includes costs not related to customer premise equipment remaining balance due at final maturity in 2013;
or our network, to secure growth of new customers, revenue generating units,
and additional bandwidth revenues, or to provide service enhancements (e.g., (a revolving credit facility of $1.5 billion, with a maturity
headend equipment). date in 2010; and
(c) Line extensions include network costs (e.g., fiber/coaxial cable, amplifiers,
electronic equipment, make-ready and design engineering) associated with
entering new service areas.
46