Charter 2006 Annual Report Download - page 45
Download and view the complete annual report
Please find page 45 of the 2006 Charter annual report below. You can navigate through the pages in the report by either clicking on the pages listed below, or by using the keyword search tool below to find specific information within the annual report.-
 1
1 -
2
-
3
-
4
-
5
-
6
-
7
-
8
-
9
-
10
-
11
-
12
-
13
-
14
-
15
-
16
-
17
-
18
-
19
-
20
-
21
-
22
-
23
-
24
-
25
-
26
-
27
-
28
-
29
-
30
-
31
-
32
-
33
-
34
-
 35
35 -
 36
36 -
 37
37 -
 38
38 -
 39
39 -
 40
40 -
 41
41 -
 42
42 -
 43
43 -
 44
44 -
 45
45 -
 46
46 -
 47
47 -
 48
48 -
 49
49 -
 50
50 -
 51
51 -
 52
52 -
 53
53 -
 54
54 -
 55
55 -
56
-
57
-
58
-
59
-
60
-
61
-
62
-
63
-
64
-
65
-
66
-
67
-
68
-
69
-
70
-
71
-
72
-
73
-
74
-
75
-
76
-
77
-
78
-
79
-
80
-
81
-
82
-
83
-
84
-
85
-
86
-
87
-
88
-
89
-
90
-
91
-
92
-
93
-
94
-
95
-
96
-
97
-
98
-
99
-
100
-
101
-
102
-
103
-
104
-
105
-
106
-
107
-
108
-
109
-
110
-
111
-
112
-
113
-
114
-
115
-
116
-
117
-
118
-
119
-
120
-
121
-
122
-
123
-
124
 |
 |

CHARTER COMMUNICATIONS, INC. 2006 FORM 10-K
ITEM 7. MANAGEMENT’S DISCUSSION AND ANALYSIS OF FINANCIAL CONDITION AND RESULTS OF
OPERATIONS.
Reference is made to ‘‘Item 1A. Risk Factors’’ and ‘‘Cautionary expanding the sales of our services to our commercial
Statement Regarding Forward-Looking Statements,’’ which customers.
describes important factors that could cause actual results to Our expenses primarily consist of operating costs, selling,
differ from expectations and non-historical information con- general and administrative expenses, depreciation and amortiza-
tained herein. In addition, the following discussion should be tion expense and interest expense. Operating costs primarily
read in conjunction with the audited consolidated financial include programming costs, the cost of our workforce, cable
statements of Charter Communications, Inc. and subsidiaries as service related expenses, advertising sales costs and franchise
of and for the years ended December 31, 2006, 2005 and 2004. fees. Selling, general and administrative expenses primarily
include salaries and benefits, rent expense, billing costs, call
Overview center costs, internal network costs, bad debt expense and
Charter is a broadband communications company operating in property taxes. Controlling our expenses impacts our ability to
the United States, with approximately 5.73 million customers at improve margins. We are attempting to control our costs of
December 31, 2006. Through our hybrid fiber and coaxial cable operations by maintaining strict controls on expenses. More
network, we offer our customers traditional cable video pro- specifically, we are focused on managing our cost structure by
gramming (analog and digital, which we refer to as ‘‘video’’ managing our workforce to control cost increases and improve
service), high-speed Internet access, advanced broadband cable productivity, and leveraging our growth and increasing size in
services (such as OnDemand, high definition television service purchasing activities. In addition, we are reviewing our pricing
and DVR) and, in many of our markets, telephone service. See and programming packaging strategies. See ‘‘Item 1. Business —
‘‘Item 1. Business — Products and Services’’ for further descrip- Programming’’ for more details.
tion of these terms, including ‘‘customers.’’ Our operating income from continuing operations increased
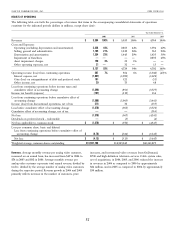
Approximately 88% of our revenues for each of the years to $367 million for the year ended December 31, 2006 from
ended December 31, 2006 and 2005, respectively, are attributa- $304 million for the year ended December 31, 2005. We had
ble to monthly subscription fees charged to customers for our positive operating margins (defined as operating income from
video, high-speed Internet, telephone, and commercial services continuing operations divided by revenues) of 7% and 6% for
provided by our cable systems. Generally, these customer the years ended December 31, 2006 and 2005, respectively. The
subscriptions may be discontinued by the customer at any time. improvement in operating income from continuing operations
The remaining 12% of revenue is derived primarily from and operating margin for the year ended December 31, 2006 is
advertising revenues, franchise fee revenues (which are collected principally due to an increase in revenue over expenses as a
by us but then paid to local franchising authorities), pay-per- result of increased customers for high-speed Internet, digital
view and OnDemand programming (where users are charged a video, and advanced services, as well as overall rate increases.
fee for individual programs viewed), installation or reconnection Operating loss from continuing operations was $1.9 billion for
fees charged to customers to commence or reinstate service, and the year ended December 31, 2004. We had a negative
commissions related to the sale of merchandise by home operating margin of 40% for the year ended December 31, 2004.
shopping services. The increase in operating income from continuing operations
The industry’s and our most significant operational chal- and positive operating margin for the year ended December 31,
lenges include competition from DBS providers and DSL service 2005 was principally due to the impairment of franchises of
providers. See ‘‘Item 1. Business — Competition.’’ We believe that $2.3 billion recorded in the third quarter of 2004, which did not
competition from DBS has resulted in net analog video recur in 2005. Although we do not expect charges for
customer losses. In addition, DBS competition combined with impairment in the future of comparable magnitude, potential
increasingly limited opportunities to expand our customer base, charges could occur due to changes in market conditions.
now that approximately 52% of our analog video customers We have a history of net losses. Further, we expect to
subscribe to our digital video service, has resulted in decreased continue to report net losses for the foreseeable future. Our net
growth rates for digital video customers. Competition from DSL losses are principally attributable to insufficient revenue to cover
providers has resulted in decreased growth rates for high-speed the combination of operating expenses and interest expenses we
Internet customers. In the recent past, we have grown revenues incur because of our high level of debt and the depreciation
by offsetting analog video customer losses with price increases expenses that we incur resulting from the capital investments we
and sales of incremental services such as high-speed Internet, have made and continue to make in our cable properties. We
OnDemand, DVR, high definition television, and telephone. We expect that these expenses will remain significant.
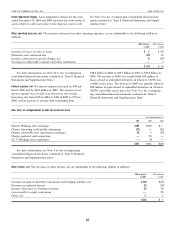
expect to continue to grow revenues through price increases, Beginning in 2004 and continuing through January 2007,
increases in the number of our customers who purchase bundled we sold several cable systems which reflects our strategy to
services, and through sales of incremental video services divest geographically non-strategic assets to allow for more
including high definition television, OnDemand and DVR efficient operations, while also increasing our liquidity. In 2004,
service. In addition, we expect to increase revenues by we sold cable systems representing a total of approximately
31