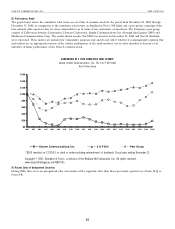
Charter 2006 Annual Report Download - page 53
Download and view the complete annual report
Please find page 53 of the 2006 Charter annual report below. You can navigate through the pages in the report by either clicking on the pages listed below, or by using the keyword search tool below to find specific information within the annual report.-
 1
1 -
2
-
3
-
4
-
5
-
6
-
7
-
8
-
9
-
10
-
11
-
12
-
13
-
14
-
15
-
16
-
17
-
18
-
19
-
20
-
21
-
22
-
23
-
24
-
25
-
26
-
27
-
28
-
29
-
30
-
31
-
32
-
33
-
34
-
35
-
36
-
37
-
38
-
39
-
40
-
41
-
42
-
 43
43 -
 44
44 -
 45
45 -
 46
46 -
 47
47 -
 48
48 -
 49
49 -
 50
50 -
 51
51 -
 52
52 -
 53
53 -
 54
54 -
 55
55 -
 56
56 -
 57
57 -
 58
58 -
 59
59 -
 60
60 -
 61
61 -
 62
62 -
 63
63 -
64
-
65
-
66
-
67
-
68
-
69
-
70
-
71
-
72
-
73
-
74
-
75
-
76
-
77
-
78
-
79
-
80
-
81
-
82
-
83
-
84
-
85
-
86
-
87
-
88
-
89
-
90
-
91
-
92
-
93
-
94
-
95
-
96
-
97
-
98
-
99
-
100
-
101
-
102
-
103
-
104
-
105
-
106
-
107
-
108
-
109
-
110
-
111
-
112
-
113
-
114
-
115
-
116
-
117
-
118
-
119
-
120
-
121
-
122
-
123
-
124
 |
 |

CHARTER COMMUNICATIONS, INC. 2006 FORM 10-K
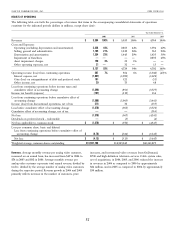
Internet service, late payment fees, wire maintenance fees and result of increases in franchise fees as a result of increases in
other miscellaneous revenues. For the years ended Decem- revenues upon which the fees apply, and increases in installation
ber 31, 2006, 2005, and 2004, franchise fees represented revenues. The increases were reduced by approximately $2 mil-
approximately 52%, 54%, and 52%, respectively, of total other lion in 2006 and $2 million in 2005 as a result of system sales.
revenues. The increase in other revenues was primarily the
Operating expenses. The increases in operating expenses are attributable to the following (dollars in millions):
2006 compared 2005 compared
to 2005 to 2004
Increases in programming costs $143 $104
Increases in labor costs 32 24
Increases in costs of providing high-speed Internet and telephone services 25 26
Increases in maintenance costs 15 24
Increases in advertising sales costs 14 4
Increases in franchise costs 11 10
Other increases, net 229
Increase related to acquisition 13 —
Decreases related to system sales (20) (12)
$235 $209
Programming costs were approximately $1.5 billion, $1.4 bil- from programmers in support of launches of new channels.
lion, and $1.3 billion, representing 61%, 62%, and 63% of total Amounts amortized against programming expenses were $32 mil-
operating expenses for the years ended December 31, 2006, 2005, lion, $41 million, and $59 million in 2006, 2005, and 2004,
and 2004, respectively. Programming costs consist primarily of respectively. We expect programming expenses to continue to
costs paid to programmers for analog, premium, digital and pay- increase due to a variety of factors, including annual increases
per-view programming. The increases in programming costs are imposed by programmers, and additional programming, including
primarily a result of rate increases, particularly in sports program- high-definition and OnDemand programming, being provided to
ming, and in 2005 were offset by a decrease in analog video customers. Labor costs increased due to an increase in headcount
customers. In addition, programming costs increased as a result of to support improved service levels and telephone deployment.
reductions in the amounts of amortization of payments received
Selling, general and administrative expenses. The increases in selling, general and administrative expenses are attributable to the following
(dollars in millions):
2006 compared 2005 compared
to 2005 to 2004
Increases (decreases) in customer care costs $56 $ (2)
Increases in marketing costs 38 23
Increases in employee costs 32 28
Increases (decreases) in bad debt and collection costs 19 (20)
Increases (decreases) in property and casualty costs 17 (6)
Increases (decreases) in professional service costs (26) 31
Other increases (decreases), net 21 (3)
Decreases related to system sales (9) (4)
Increase related to acquisition 5—
$153 $47
Depreciation and amortization. Depreciation and amortization Impairment of franchises. The use of lower projected growth rates
expense decreased by $89 million in 2006 and increased by and the resulting revised estimates of future cash flows in our
$10 million in 2005. During 2006, the decrease in depreciation valuation, primarily as a result of increased competition, led to
was primarily the result of systems sales and certain assets the recognition of a $2.4 billion impairment charge for the year
becoming fully depreciated. During 2005, the increase in ended December 31, 2004. Our annual assessments in 2006 and
depreciation was related to an increase in capital expenditures, 2005 did not result in impairment.
which was partially offset by lower depreciation as the result of
systems sales and certain assets becoming fully depreciated.
39