Charter 2006 Annual Report Download - page 3
Download and view the complete annual report
Please find page 3 of the 2006 Charter annual report below. You can navigate through the pages in the report by either clicking on the pages listed below, or by using the keyword search tool below to find specific information within the annual report.-
 1
1 -
 2
2 -
 3
3 -
 4
4 -
 5
5 -
 6
6 -
 7
7 -
 8
8 -
 9
9 -
 10
10 -
 11
11 -
 12
12 -
 13
13 -
 14
14 -
15
-
16
-
17
-
18
-
19
-
20
-
21
-
22
-
23
-
24
-
25
-
26
-
27
-
28
-
29
-
30
-
31
-
32
-
33
-
34
-
35
-
36
-
37
-
38
-
39
-
40
-
41
-
42
-
43
-
44
-
45
-
46
-
47
-
48
-
49
-
50
-
51
-
52
-
53
-
54
-
55
-
56
-
57
-
58
-
59
-
60
-
61
-
62
-
63
-
64
-
65
-
66
-
67
-
68
-
69
-
70
-
71
-
72
-
73
-
74
-
75
-
76
-
77
-
78
-
79
-
80
-
81
-
82
-
83
-
84
-
85
-
86
-
87
-
88
-
89
-
90
-
91
-
92
-
93
-
94
-
95
-
96
-
97
-
98
-
99
-
100
-
101
-
102
-
103
-
104
-
105
-
106
-
107
-
108
-
109
-
110
-
111
-
112
-
113
-
114
-
115
-
116
-
117
-
118
-
119
-
120
-
121
-
122
-
123
-
124
 |
 |

1
4Q 1Q 2Q 3Q 4Q
2005 2006 2006 2006 2006
10,379
10,606
10,717
10,927
11,09 0
+7%
change 2005-2006
10,000
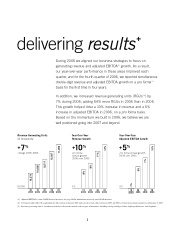
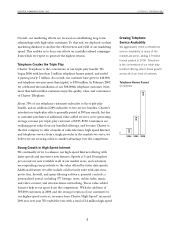
During 2006 we aligned our business strategies to focus on
generating revenue and adjusted EBITDA(1) growth. As a result,
our year-over-year performance in these areas improved each
quarter, and for the fourth quarter of 2006, we reported simultaneous
double-digit revenue and adjusted EBITDA growth on a pro forma(2)
basis for the first time in four years.
In addition, we increased revenue generating units (RGUs(3)) by
7% during 2006, adding 64% more RGUs in 2006 than in 2005.
This growth helped drive a 10% increase in revenue and a 5%
increase in adjusted EBITDA in 2006, on a pro forma basis.
Based on the momentum we built in 2006, we believe we are
well positioned going into 2007 and beyond.
delivering results+
Revenue Generating Units
(in thousands)
Year-Over-Year
Revenue Growth
Year-Over-Year
Adjusted EBITDA Growth
1Q 2Q 3Q 4Q
2006 2006 2006 2006
8%
9%
11%
12%
+
10 %
pro forma
annual growth
2006 over 2005
5%
1Q 2Q 3Q 4Q
2006 2006 2006 2006
-1%
7%
5%
10%
+5%
pro forma annual growth
2006 over 2005
0%
(1) Adjusted EBITDA is a non-GAAP financial measure. See page 110 for information on use of non-GAAP measures.
(2) Pro forma results reflect the acquisition of cable systems in January 2006 and sales of certain cable systems in 2005 and 2006 as if such transactions occurred as of January 1, 2005.
(3) Revenue generating units is an industry term that refers to the sum of each category of customers, including analog and digital video, high-speed Internet, and telephone.