Charter 2006 Annual Report Download - page 121
Download and view the complete annual report
Please find page 121 of the 2006 Charter annual report below. You can navigate through the pages in the report by either clicking on the pages listed below, or by using the keyword search tool below to find specific information within the annual report.-
 1
1 -
2
-
3
-
4
-
5
-
6
-
7
-
8
-
9
-
10
-
11
-
12
-
13
-
14
-
15
-
16
-
17
-
18
-
19
-
20
-
21
-
22
-
23
-
24
-
25
-
26
-
27
-
28
-
29
-
30
-
31
-
32
-
33
-
34
-
35
-
36
-
37
-
38
-
39
-
40
-
41
-
42
-
43
-
44
-
45
-
46
-
47
-
48
-
49
-
50
-
51
-
52
-
53
-
54
-
55
-
56
-
57
-
58
-
59
-
60
-
61
-
62
-
63
-
64
-
65
-
66
-
67
-
68
-
69
-
70
-
71
-
72
-
73
-
74
-
75
-
76
-
77
-
78
-
79
-
80
-
81
-
82
-
83
-
84
-
85
-
86
-
87
-
88
-
89
-
90
-
91
-
92
-
93
-
94
-
95
-
96
-
97
-
98
-
99
-
100
-
101
-
102
-
103
-
104
-
105
-
106
-
107
-
108
-
109
-
110
-
 111
111 -
 112
112 -
 113
113 -
 114
114 -
 115
115 -
 116
116 -
 117
117 -
 118
118 -
 119
119 -
 120
120 -
 121
121 -
 122
122 -
 123
123 -
 124
124
 |
 |

111
CHARTER COMMUNICATIONS, INC. AND SUBSIDIARIES 2006 ANNUAL REPORT
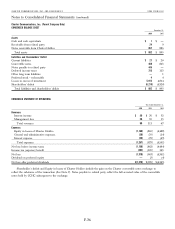
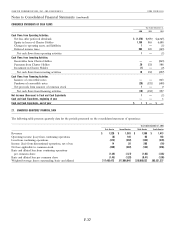
Unaudited Reconciliation of Non-GAAP Measures to GAAP Measures
(dollars in millions)
2006 pro forma (1) 1st Quarter 2nd Quarter 3rd Quarter 4th Quarter 2006
Revenues $1,292 $1,355 $1,377 $1,413 $5,437
Less: Operating costs and expenses
Programming costs 367 370 368 368 1,473
Service 198 200 214 211 823
Advertising sales 24 26 28 29 107
General and administrative 228 229 248 258 963
Marketing 36 43 56 44 179
Operating costs and expenses 853 868 914 910 3,545
Adjusted EBITDA 439 487 463 503 1,892
Less: Purchases of property, plant, and equipment 233 290 254 308 1,085
Un-levered free cash flow 206 197 209 195 807
Less: Interest on cash pay obligations 406 424 445 448 1,723
Free cash flow (200) (227) (236) (253) (916)
Purchases of property, plant, and equipment 233 290 254 308 1,085
Special charges, net (3) (7) (2) (1) (13)
Other, net (2) (2) (1) 3 (2)
Change in operating assets and liabilities 159 (74) 124 (82) 127
Net cash flows from operating activities $ 187 $ (20) $ 139 $ (25) $ 281
2005 pro forma 1st Quarter 2nd Quarter 3rd Quarter 4th Quarter 2005
Revenues $1,193 $1,242 $1,242 $1,265 $4,942
Less: Operating costs and expenses
Programming costs 335 329 336 331 1,331
Service 168 183 193 193 737
Advertising sales 23 23 24 23 93
General and administrative 190 212 219 223 844
Marketing 34 30 37 39 140
Operating costs and expenses 750 777 809 809 3,145
Adjusted EBITDA 443 465 433 456 1,797
Less: Purchases of property, plant, and equipment 205 319 264 262 1,050
Un-levered free cash flow 238 146 169 194 747
Less: Interest on cash pay obligations 367 379 378 377 1,501
Free cash flow (129) (233) (209) (183) (754)
Purchases of property, plant, and equipment 205 319 264 262 1,050
Special charges, net (4) — — (3) (7)
Other, net (6) (3) (1) (2) (12)
Change in operating assets and liabilities 59 (81) (137) 46 (113)
Net cash flows from operating activities $ 125 $ 2 $ (83) $ 120 $ 164
(1) Pro forma results reflect the acquisition of cable systems in January 2006 from Seren Innovations, Inc. and the sales of systems in July 2005 to Rapid Communications, LLC and
McDonald Investment Company, Inc. and in the third quarter of 2006 to Cebridge Connections, Inc., New Wave Communications, Orange Broadband Holding Company, LLC
and Allegiance Communications, LLC as if they occurred as of January 1, 2005 for all periods presented.