Coca Cola 2005 Annual Report Download - page 100
Download and view the complete annual report
Please find page 100 of the 2005 Coca Cola annual report below. You can navigate through the pages in the report by either clicking on the pages listed below, or by using the keyword search tool below to find specific information within the annual report.-
 1
1 -
2
-
3
-
4
-
5
-
6
-
7
-
8
-
9
-
10
-
11
-
12
-
13
-
14
-
15
-
16
-
17
-
18
-
19
-
20
-
21
-
22
-
23
-
24
-
25
-
26
-
27
-
28
-
29
-
30
-
31
-
32
-
33
-
34
-
35
-
36
-
37
-
38
-
39
-
40
-
41
-
42
-
43
-
44
-
45
-
46
-
47
-
48
-
49
-
50
-
51
-
52
-
53
-
54
-
55
-
56
-
57
-
58
-
59
-
60
-
61
-
62
-
63
-
64
-
65
-
66
-
67
-
68
-
69
-
70
-
71
-
72
-
73
-
74
-
75
-
76
-
77
-
78
-
79
-
80
-
81
-
82
-
83
-
84
-
85
-
86
-
87
-
88
-
89
-
 90
90 -
 91
91 -
 92
92 -
 93
93 -
 94
94 -
 95
95 -
 96
96 -
 97
97 -
 98
98 -
 99
99 -
 100
100 -
 101
101 -
 102
102 -
 103
103 -
 104
104 -
 105
105 -
 106
106 -
 107
107 -
 108
108 -
 109
109 -
 110
110 -
111
-
112
-
113
-
114
-
115
-
116
-
117
-
118
-
119
-
120
-
121
-
122
-
123
-
124
-
125
-
126
-
127
-
128
-
129
-
130
-
131
-
132
-
133
-
134
-
135
-
136
-
137
-
138
-
139
-
140
-
141
-
142
 |
 |

THE COCA-COLA COMPANY AND SUBSIDIARIES
NOTES TO CONSOLIDATED FINANCIAL STATEMENTS
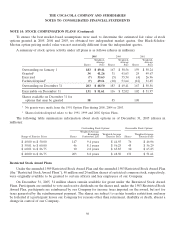
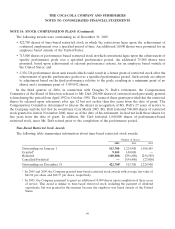
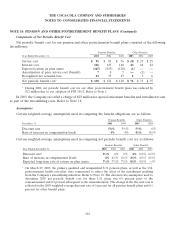
NOTE 14: STOCK COMPENSATION PLANS (Continued)
To ensure the best market-based assumptions were used to determine the estimated fair value of stock
options granted in 2005, 2004 and 2003, we obtained two independent market quotes. Our Black-Scholes-
Merton option-pricing model value was not materially different from the independent quotes.
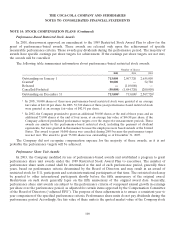
A summary of stock option activity under all plans is as follows (shares in millions):
2005 2004 2003
Weighted- Weighted- Weighted-
Average Average Average
Shares Price Shares Price Shares Price
Outstanding on January 1 183 $ 49.41 167 $ 50.56 159 $ 50.24
Granted134 41.26 31 41.63 24 49.67
Exercised (7) 35.63 (5) 35.54 (4) 26.96
Forfeited/expired2(7) 49.11 (10) 51.64 (12) 51.45
Outstanding on December 31 203 $ 48.50 183 $ 49.41 167 $ 50.56
Exercisable on December 31 131 $ 51.61 116 $ 52.02 102 $ 51.97
Shares available on December 31 for
options that may be granted 58 85 108
1No grants were made from the 1991 Option Plan during 2005, 2004 or 2003.
2Shares forfeited/expired relate to the 1991, 1999 and 2002 Option Plans.
The following table summarizes information about stock options as of December 31, 2005 (shares in
millions):
Outstanding Stock Options Exercisable Stock Options
Weighted-Average
Remaining Weighted-Average Weighted-Average
Range of Exercise Prices Shares Contractual Life Exercise Price Shares Exercise Price
$ 40.00 to $ 50.00 147 9.4 years $ 44.93 76 $ 46.96
$ 50.01 to $ 60.00 46 8.1 years $ 56.25 45 $ 56.29
$ 60.01 to $ 86.75 10 2.8 years $ 65.85 10 $ 65.85
$ 40.00 to $ 86.75 203 8.8 years $ 48.50 131 $ 51.61
Restricted Stock Award Plans
Under the amended 1989 Restricted Stock Award Plan and the amended 1983 Restricted Stock Award Plan
(the ‘‘Restricted Stock Award Plans’’), 40 million and 24 million shares of restricted common stock, respectively,
were originally available to be granted to certain officers and key employees of our Company.
On December 31, 2005, 31 million shares remain available for grant under the Restricted Stock Award
Plans. Participants are entitled to vote and receive dividends on the shares and, under the 1983 Restricted Stock
Award Plan, participants are reimbursed by our Company for income taxes imposed on the award, but not for
taxes generated by the reimbursement payment. The shares are subject to certain transfer restrictions and may
be forfeited if a participant leaves our Company for reasons other than retirement, disability or death, absent a
change in control of our Company.
98