Coca Cola 2005 Annual Report Download - page 50
Download and view the complete annual report
Please find page 50 of the 2005 Coca Cola annual report below. You can navigate through the pages in the report by either clicking on the pages listed below, or by using the keyword search tool below to find specific information within the annual report.-
 1
1 -
2
-
3
-
4
-
5
-
6
-
7
-
8
-
9
-
10
-
11
-
12
-
13
-
14
-
15
-
16
-
17
-
18
-
19
-
20
-
21
-
22
-
23
-
24
-
25
-
26
-
27
-
28
-
29
-
30
-
31
-
32
-
33
-
34
-
35
-
36
-
37
-
38
-
39
-
 40
40 -
 41
41 -
 42
42 -
 43
43 -
 44
44 -
 45
45 -
 46
46 -
 47
47 -
 48
48 -
 49
49 -
 50
50 -
 51
51 -
 52
52 -
 53
53 -
 54
54 -
 55
55 -
 56
56 -
 57
57 -
 58
58 -
 59
59 -
 60
60 -
61
-
62
-
63
-
64
-
65
-
66
-
67
-
68
-
69
-
70
-
71
-
72
-
73
-
74
-
75
-
76
-
77
-
78
-
79
-
80
-
81
-
82
-
83
-
84
-
85
-
86
-
87
-
88
-
89
-
90
-
91
-
92
-
93
-
94
-
95
-
96
-
97
-
98
-
99
-
100
-
101
-
102
-
103
-
104
-
105
-
106
-
107
-
108
-
109
-
110
-
111
-
112
-
113
-
114
-
115
-
116
-
117
-
118
-
119
-
120
-
121
-
122
-
123
-
124
-
125
-
126
-
127
-
128
-
129
-
130
-
131
-
132
-
133
-
134
-
135
-
136
-
137
-
138
-
139
-
140
-
141
-
142
 |
 |

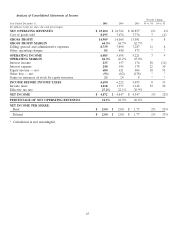
April 2, 2004, of variable interest entities under Interpretation 46(R). Generally, bottling and finished product
operations, such as our Japan tea business, which was integrated into the supply chain company, produce higher
net revenues but lower gross profit margins compared to concentrate and syrup operations.
Selling, General and Administrative Expenses
The following table sets forth the significant components of selling, general and administrative expenses (in
millions):
Year Ended December 31, 2005 2004 2003
Selling expenses $ 3,453 $ 3,031 $ 2,937
Advertising expenses 2,475 2,165 1,822
General and administrative expenses 2,487 2,349 2,121
Stock-based compensation expense 324 345 407
Selling, general and administrative expenses $ 8,739 $ 7,890 $ 7,287
Selling, general and administrative expenses were approximately 11 percent higher in 2005 versus 2004.
Approximately 1 percentage point of this increase was due to an overall weaker U.S. dollar (especially compared
to the Brazilian real, the Mexican peso and the euro). The increase in selling, advertising and general and
administrative expenses is primarily related to increased marketing and innovation expenses and the full-year
impact of the consolidation of certain bottling operations under Interpretation 46(R). Our Company intends to
maintain the increased level in marketing and innovation spending for the foreseeable future. The decrease in
stock-based compensation expense is primarily related to the lower average fair value per share of stock options
expensed in the current year compared to the average fair value per share expensed in 2004. This decrease was
partially offset by approximately $50 million of accelerated amortization of compensation expense related to a
change in our estimated service period for retirement-eligible participants when the terms of their stock-based
compensation awards provided for accelerated vesting upon early retirement. Refer to Note 14 of Notes to
Consolidated Financial Statements.
Selling, general and administrative expenses were approximately 8 percent higher in 2004 versus 2003.
Approximately 3 percentage points of this increase was due to an overall weaker U.S. dollar (especially
compared to the euro and Japanese yen). Increased selling expenses were due to increased delivery costs related
to our Company’s finished products business and structural changes. Increased advertising expenses were the
result of investments in marketing activities, such as the launch of new products in North America and Japan.
Additionally, general and administrative expenses increased due to higher legal expenses, asset write-offs and
structural changes. Finally, we received a $75 million insurance settlement related to the class action lawsuit that
was settled in 2000. The Company subsequently donated $75 million to The Coca-Cola Foundation.
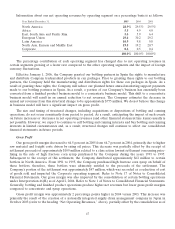
Other Operating Charges
The other operating charges incurred by operating segment were as follows (in millions):
Year Ended December 31, 2005 2004 2003
North America $— $ 18 $ 273
Africa ——12
East, South Asia and Pacific Rim 85 15 11
European Union —368 157
Latin America —620
North Asia, Eurasia and Middle East —933
Corporate —64 67
Total $85 $ 480 $ 573
48