Coca Cola 2005 Annual Report Download - page 62
Download and view the complete annual report
Please find page 62 of the 2005 Coca Cola annual report below. You can navigate through the pages in the report by either clicking on the pages listed below, or by using the keyword search tool below to find specific information within the annual report.-
 1
1 -
2
-
3
-
4
-
5
-
6
-
7
-
8
-
9
-
10
-
11
-
12
-
13
-
14
-
15
-
16
-
17
-
18
-
19
-
20
-
21
-
22
-
23
-
24
-
25
-
26
-
27
-
28
-
29
-
30
-
31
-
32
-
33
-
34
-
35
-
36
-
37
-
38
-
39
-
40
-
41
-
42
-
43
-
44
-
45
-
46
-
47
-
48
-
49
-
50
-
51
-
 52
52 -
 53
53 -
 54
54 -
 55
55 -
 56
56 -
 57
57 -
 58
58 -
 59
59 -
 60
60 -
 61
61 -
 62
62 -
 63
63 -
 64
64 -
 65
65 -
 66
66 -
 67
67 -
 68
68 -
 69
69 -
 70
70 -
 71
71 -
 72
72 -
73
-
74
-
75
-
76
-
77
-
78
-
79
-
80
-
81
-
82
-
83
-
84
-
85
-
86
-
87
-
88
-
89
-
90
-
91
-
92
-
93
-
94
-
95
-
96
-
97
-
98
-
99
-
100
-
101
-
102
-
103
-
104
-
105
-
106
-
107
-
108
-
109
-
110
-
111
-
112
-
113
-
114
-
115
-
116
-
117
-
118
-
119
-
120
-
121
-
122
-
123
-
124
-
125
-
126
-
127
-
128
-
129
-
130
-
131
-
132
-
133
-
134
-
135
-
136
-
137
-
138
-
139
-
140
-
141
-
142
 |
 |

We use 46 functional currencies. Due to our global operations, weaknesses in some of these currencies
might be offset by strengths in others. In 2005, 2004 and 2003, the weighted-average exchange rates for foreign
currencies in which the Company conducted operations (all operating currencies), and for certain individual
currencies, strengthened (weakened) against the U.S. dollar as follows:
Year Ended December 31, 2005 2004 2003
All operating currencies 2% 6% 8%
Brazilian real 21 % 5 % (11)%
Mexican peso 4% (5)% (11)%
Australian dollar 3% 13 % 20 %
Euro 1% 9 % 21 %
South African rand 1% 18 % 41 %
British pound 0% 12 % 8 %
Japanese yen (1)% 7% 8%
These percentages do not include the effects of our hedging activities and, therefore, do not reflect the
actual impact of fluctuations in exchange rates on our operating results. Our foreign currency management
program is designed to mitigate, over time, a portion of the impact of exchange rates on net income and earnings
per share. The total currency impact on operating income, including the effect of our hedging activities, was an
increase of approximately 4 percent, 8 percent and 2 percent in 2005, 2004 and 2003, respectively. In 2006, the
Company expects a negative impact on operating income from currencies.
Exchange losses—net amounted to approximately $23 million in 2005, $39 million in 2004 and $76 million
in 2003 and were recorded in other loss—net in our consolidated statements of income. Exchange losses—net
include the remeasurement of monetary assets and liabilities from certain currencies into functional currencies
and the costs of hedging certain exposures of our consolidated balance sheets. Refer to Note 11 of Notes to
Consolidated Financial Statements.
The Company will continue to manage its foreign currency exposure to mitigate, over time, a portion of the
impact of exchange rate changes on net income and earnings per share.
Overview of Financial Position
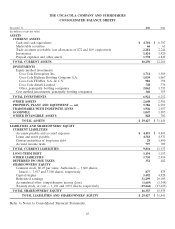
Our consolidated balance sheet as of December 31, 2005, compared to our consolidated balance sheet as of
December 31, 2004, was impacted by the following:
• The decrease in loans and notes payable of $13 million was primarily due to the decrease of commercial
paper borrowings during 2005 of $924 million and was offset by the reclassification of the payment to be
made to CCEAG shareholders from other liabilities to loans and notes payable. Refer to Note 7 of Notes
to Consolidated Financial Statements.
• The increase in our equity method investments in 2005 of $665 million was primarily due to the payment
of approximately $250 million for our share of the joint acquisition of Multon. The increase also includes
the impact of the strength in most key currencies versus the U.S. dollar and equity income, net of
dividends. Refer to Note 2 of Notes to Consolidated Financial Statements.
• The overall decrease in total assets of $2,014 million as of December 31, 2005, compared to
December 31, 2004, was primarily related to the decrease in cash and cash equivalents, which impacted
the Corporate operating segment. The decrease was also due to impairment charges primarily for
trademarks amounting to approximately $85 million. The decrease was partially offset by the impact of
the strength in most key currencies versus the U.S. dollar, especially a stronger Brazilian real and
Mexican peso (which impacted the Latin America operating segment) and a stronger euro (which
60