Coca Cola 2005 Annual Report Download - page 51
Download and view the complete annual report
Please find page 51 of the 2005 Coca Cola annual report below. You can navigate through the pages in the report by either clicking on the pages listed below, or by using the keyword search tool below to find specific information within the annual report.-
 1
1 -
2
-
3
-
4
-
5
-
6
-
7
-
8
-
9
-
10
-
11
-
12
-
13
-
14
-
15
-
16
-
17
-
18
-
19
-
20
-
21
-
22
-
23
-
24
-
25
-
26
-
27
-
28
-
29
-
30
-
31
-
32
-
33
-
34
-
35
-
36
-
37
-
38
-
39
-
40
-
 41
41 -
 42
42 -
 43
43 -
 44
44 -
 45
45 -
 46
46 -
 47
47 -
 48
48 -
 49
49 -
 50
50 -
 51
51 -
 52
52 -
 53
53 -
 54
54 -
 55
55 -
 56
56 -
 57
57 -
 58
58 -
 59
59 -
 60
60 -
 61
61 -
62
-
63
-
64
-
65
-
66
-
67
-
68
-
69
-
70
-
71
-
72
-
73
-
74
-
75
-
76
-
77
-
78
-
79
-
80
-
81
-
82
-
83
-
84
-
85
-
86
-
87
-
88
-
89
-
90
-
91
-
92
-
93
-
94
-
95
-
96
-
97
-
98
-
99
-
100
-
101
-
102
-
103
-
104
-
105
-
106
-
107
-
108
-
109
-
110
-
111
-
112
-
113
-
114
-
115
-
116
-
117
-
118
-
119
-
120
-
121
-
122
-
123
-
124
-
125
-
126
-
127
-
128
-
129
-
130
-
131
-
132
-
133
-
134
-
135
-
136
-
137
-
138
-
139
-
140
-
141
-
142
 |
 |

Other operating charges in 2005 reflected the impact of approximately $84 million of expenses related to
impairment charges for intangible assets and approximately $1 million related to an impairment of other assets.
These intangible assets primarily relate to trademark beverages sold in the Philippines, which is part of the East,
South Asia and Pacific Rim operating segment. Refer to the heading ‘‘Critical Accounting Policies and
Estimates—Goodwill, Trademarks and Other Intangible Assets.’’
Other operating charges in 2004 reflected the impact of approximately $480 million of expenses primarily
related to impairment charges for franchise rights and certain manufacturing assets. The European Union
operating segment accounted for approximately $368 million of the impairment charges, which were primarily
related to the impairment of franchise rights at CCEAG. For a discussion of the operating environment in
Germany, refer to the heading ‘‘Critical Accounting Policies and Estimates—Goodwill, Trademarks and Other
Intangible Assets.’’ The Corporate operating segment accounted for approximately $64 million of impairment
charges, which were primarily related to the impairment of certain manufacturing assets.
Other operating charges in 2003 included the impact of approximately $561 million of expenses related to
the 2003 streamlining initiatives. A majority of the charges related to initiatives in North America and Germany.
In North America, the Company integrated the operations of three separate North American business units—
Coca-Cola North America, The Minute Maid Company and Coca-Cola Fountain. In Germany, CCEAG took
steps to improve its efficiency in sales, distribution and manufacturing, and our German Division office also
implemented streamlining initiatives. Selected other locations also took steps to streamline their operations to
improve overall efficiency and effectiveness. These initiatives resulted in the separation of approximately 3,700
associates in 2003, primarily in North America and Germany, and certain countries in the East, South Asia and
Pacific Rim operating segment. Refer to Note 18 of Notes to Consolidated Financial Statements.
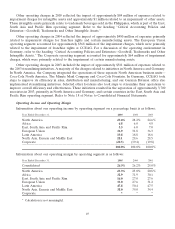
Operating Income and Operating Margin
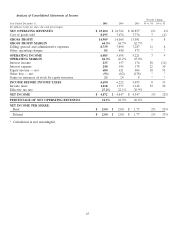
Information about our operating income by operating segment on a percentage basis is as follows:
Year Ended December 31, 2005 2004 2003
North America 25.6% 28.2% 24.6%
Africa 6.8 6.0 4.8
East, South Asia and Pacific Rim 3.3 6.0 7.0
European Union 36.9 31.8 36.3
Latin America 19.8 18.8 18.6
North Asia, Eurasia and Middle East 28.1 28.6 28.5
Corporate (20.5) (19.4) (19.8)
100.0% 100.0% 100.0%
Information about our operating margin by operating segment is as follows:
Year Ended December 31, 2005 2004 2003
Consolidated 26.3% 26.2% 25.0%
North America 23.3% 25.0% 20.8%
Africa 32.9 31.9 30.1
East, South Asia and Pacific Rim 16.0 27.0 27.6
European Union 33.0 27.6 31.2
Latin America 47.8 50.4 47.5
North Asia, Eurasia and Middle East 38.0 39.0 34.4
Corporate ***
* Calculation is not meaningful.
49